School inspection data summary report (IDSR) guide
This guide gives an overview of the inspection data summary report (IDSR) for primary and secondary schools, along with information to help interpret the charts.
Applies to England
Overview of the Ofsted IDSR
This guide is for primary and secondary schools,schools including those with a sixth form.
The Ofsted IDSR is now a web-based page showing data for Ofsted inspectors to use when preparing for and during inspection. The IDSR is designed to align with our school inspection handbook, so that areas of interest can be used to informidentify inspection conversations.trails.
The IDSR can contain sensitive information about schools and colleges. It is your responsibility to ensure that the IDSR is stored and shared appropriately. Please see our IDSR conditions of use and storage statement.
ForPerformance phonics,data keyfor stage2022 1should not be directly compared with 2019 and keyearlier. stageComparisons 2should data,not thebe standardsmade between schools. This is because schools may have been keptaffected consistentdifferently betweenby 2022COVID-19. Historical performance data from 2019 and 2023earlier data;indicates therefore,the itschool iscontext possiblebefore the pandemic. For 2022, the IDSR quintiles have been removed.
Responding to comparefeedback, datawe acrosshave thesenow years.introduced However,a button at the top of the IDSR willthat notallows directlyusers compareto dataremove acrossgrey years.sentence Forcontent keyfrom stagethe 4report. andThese 16grey sentences show that the area has been reviewed, but there is nothing significant to 18,highlight.
The duebox to ahide differentgrey gradingtext approachis inlocated 2022,at itthe isvery nottop possibleof the report with the following text: ‘Select to makeshow directonly comparisonssentences betweenfor 2022areas andwhich 2023.are Assignificant withor primaryexceptional’. data,Underneath thethis IDSRtext doesis nota makeuser directdefined comparisonsbox acrossthat years.you Instead,can theselect IDSRor containsdeselect.
Once arrows thatthe indicatebox whetheris ticked, the schoolreport valuewill comparedonly withdisplay thethose nationalsentences valuewhere eachsomething yearsignificant has changed.been Therehighlighted, arefor furtherexample, detailsprogress aboutwas howsignificantly below national and in bottom 20%. You can deselect the arrowsbox areto calculatedbring laterthe ingrey thissentences document.back.
Anonymised IDSRs
These anonymised IDSRs are examples for a primary school and a secondary school with a sixth form:school:
IDSR reports are dynamically generated based on varying school data and can differ from school to school.
Access your school’s Ofsted IDSR
As a web page throughvia our new website
You can access it directly through our new Ofsted IDSR service or from the Department for Education (DfE)’s Analyse School Performance (ASP) service. You will need a DfE Sign-in account and associated permissions for the school(s). We recommend that users with more than one school use our direct link.
Download and use offline
If you want to use the IDSR offline,offline you have several options.
Option 1 – click the ‘download this page’ button located at the top of the web page. This will download the HTML page automatically to your downloads folder. You do not need an internet connection to view and share it.
Option 2 – click the ‘print this page’ button. This will take you to the print configuration page where you can print as a hard copy document.
Option 3 – click the ‘print this page’ button. This will take you to the print configuration page where under printer you can select ‘save as PDF’.pdf’. This will convert the page into a PDF which can then be saved and shared. (Please note that this is reliant on you having the correct up-to-dateup to date software. Older versions may not support this functionality.)
Ofsted IDSR 20232022
As outlined in the school inspection handbook, inspectors will gather evidence of the impact of the quality of education from various sources. This includes nationally generated performance information about pupils’ progress and attainment. The IDSR can only provide a starting point, however. Inspectors want to see first-hand the quality of education as experienced by pupils and understand how well leaders know what it is like to be a pupil at the school.
Supporting data tables used for the 2022 IDSR show national figures and quintile boundaries used to determine whether areas of interest sentences are triggered. To determine the quintile, the data for each school is percentile ranked from 1 to 100. If the score is in percentile 1 then this is the highest rank. If the score is in percentile 100 then this is the lowest rank. These ranks are then grouped into 5 quintiles. Ranks 1–20 are in quintile 1, ranks 21–40 are in quintile 2 and so on. The quintile boundaries document shows which scores fall within each quintile.
The areas of interest sentence master list details all the sentences that are possible to have on the areas of interest pages of the 2022 IDSR.
The Ofsted IDSR has been designed to:
-
reduce the time spent preparing for an inspection
-
provide interpretation of the data for inspectors
-
minimise the focus on small groups that distract the conversation away from meeting the needs of all pupils
The IDSR continues to contain areas of interest sentences to highlight important data trends and differences from national data.
Where applicable, the Ofsted IDSR contains:
-
School
Areascharacteristicsofinterest Subjectattainmentandprogressatkeystage4and52022,20222019,20182017data-
Ethnicity
Progressatkeystage42022,2019,2018and2017 -
Prior
Attainmentattainmentatkeystage42022,prior2019,2018and2017 -
SEND
Englishcharacteristics&mathematicsresits2019data -
Staffing
Readingattainmentandprogressatkeystage22019,20182017data -
Links
Writingtoattainmentalternativeandprovisionprogressandatotherkeyprovidersstage22022,2019,2018and2017 -
Absence
Mathematicsattainmentandprogressatkeystage22022,2019,2018and2017 -
Suspensions
Otherandattainmentpermanentmeasuresexclusionsatkeystage22022,2020/212019,20182017data -
Pupil movement – based on movement between Jan 2021
2020and Jan 20222021census, Jan2019andJancensus2018andJan2019 -
Progress
Absenceand–attainmentbasedatonkey2021/22,stagessummer12021,autumn2020earlier–databased(uponto2023keydatastage4) -
Subject
Suspensionsentriesandatpermanentkeyexclusionsstage 4 – based on 20222020/21,2019/202018/19data(allkeystages) -
Progress
Keyandstageattainment5atqualificationkeytypesstageand4retention– based on 20222022,2019and2018 -
Destinations at key stage 4 – based on 2019/20, 2018/19 and 2017/18 data
-
16
Pupiltogroups18 qualification types and retention – based on 2022(allkeystages)2021/22(absence) -
Subject
Schoolentriesandatlocal16contextto 18 – based on 20222022,2021,20202019data -
Attainment
Yearatgroup16contextto 18 – based on 2022 data -
Destinations
Progress16andtoattainment18charts– based on 2019/20,2022,2018/192019,20182017data -
Pupil
Subjectgroupsentriesdataatkeystage4and52022,(primary),20212022 (secondary) and 2021/222019(absence)data
The sixth-form sections of the IDSR includes 2022 provisional DfE school and college attainment data. The destinations measures show revised data for destinations of students in the academic year 2020 to 2021, which was released by the DfE in October 2022. Value added data was not available for 2022.
Predecessor or successor link
If applicable, the Ofsted IDSR service will provide a link to a predecessor or successor provider to view. Some providers with a predecessor will not have a link. This is because weit was decided not to not include predecessors where there was no data on the predecessor school.
School details
The school details information at the beginning of the report comes from the DfE’s ‘Get information about schools (GIAS)’ service. This data is correct as of the release date on the IDSR.
Report information
The Ofsted IDSR will always show which release of performance data the report is based on. It will also show the date that the report was last released.
For example:
Release information: Provisional 20232022 Phonics, Provisional 20232022 KS1, Provisional-Provisional 20232022 KS2, Revised 20232019 KS4, Revised 20232019 16 to 18KS5
Release date: 20 October 20232022
TrustAreas information
ThisThe expandableareas sectionof providesinterest informationin about the trustIDSR are sentences providing inspectors with interpretation of a school’s historical data. Due to whichCOVID-19 and the schoolimpact belongs.it Onlyhas schoolshad thaton areschools, partthe ofway awe multi-academypresent trustthe (MAT)latest willperformance getdata this(2022) sectionhas ofchanged. theThe report.
It2022 data will havebe informationpresented aboutin theisolation numberand ofshould not be directly compared to previous years. This is because schools inmay thehave trustbeen affected differently by COVID-19.
Historical performance data from 2019 and earlier indicates the latestschool overallcontext effectivenessbefore gradesthe ofpandemic. For 2022, the IDSR will only highlight if schools withinwere in the trusts.highest or lowest 20% of all schools.
TheFor gradethe profilehistorical ofperformance schoolsdata within a MATsentence willmay displaybe thetriggered judgementsby ahigh schoolor haslow receivedperformance, undereither itsacross current3 URN.years, Itthe willlast display2 years or in the latest inspectionyear. outcome,Similarly, whichwe couldgenerate besentences eitherfor gradedabsences orand ungraded.exclusions Ifwhen adata schoolis receivedparticularly ahigh gradeor beforelow. joiningSome sentences describe the MAT,data, thensuch as those relating to the schoolreasons willfor bepermanent countedexclusions.
Please note: areas of interest sentences are shown in grey and italicised (not triggered) when there is not something significant to note, the ‘notcriteria yethave inspected’not sectionbeen untilmet itfor a minimum of the latest year, or data relates to a small cohort. For progress and attainment, this is inspectedconfirmed ason partthe ‘Progress and attainment trend’ section of the MATIDSR.
School andThe localschool’s context
Schooldata characteristics
Theis charteither showsin school-levelthe information,highest based20% onand significantly above national or the annuallowest January20% schooland census,significantly forbelow 2021,national 2022(for andat 2023.least Ifthe alatest schoolyear) hasto trigger a sixthsentence form,which ais separatenot rowgrey. willThese appeargrey sentences are included to show inspectors that showsthe data has been analysed, but is not an area of interest. At the contexttop of the report you can select to show only sentences for Yearsareas 12,which 13are andsignificant 14,or whereexceptional.
Example applicable.sentence
TheFor chartthe containswhole theschool, followingthere measures:is nothing significant or exceptional to highlight for total suspensions compared to either all schools or schools with a similar level of deprivation in 2020/21, therefore no conclusions can be drawn from this data.
-
Asmentioned,sentencesarenotproducedwhencohortsareverysmall,namelycohorts10onorrollfewer.Sentencesaboutpermanentexclusionswillappearforeveryschool,regardlessofcohortsize. -
the
Schoolspercentageareofrankedpupilsagainstinotherreceiptstateoffundedfreeschools(excludingspecialschools)withavalidlevel(FSM)value.atForthesometimemeasures,ofrankingthehasJanuarynotcensus;beenthesepossiblepupilsbecausetherenotwhoenoughare/havedistinctbeenvalueseligibleacrossforallFSMschoolsandtohaveproduceclaimedadequatethemranks(1–100).Forexample,thismayhappenwhenlookingatlowpriorattainmentbecausetheremaybefewervaluestorankformeasures.SubjectsSubjectinentriestheatlastkey6stageyears4(Reception–2022Thesesubjectsentencesrelatethe11);entryFSMintosubjectsin2022.Theremaybesomedifferencesbetween2022entriesandearlieryears.Forexample,in2022earlyentriesarenotincludedinattainmentbutareincludedinentries.In2021,earlyentrieswereincludedforinsixththeformsentriesdataeither. -
EnglishBaccalaureateentrythe
ThepercentageEnglishBaccalaureate(EBacc)isasetsubjectswithatSENDGCSEwhothatdokeepsnotyoungpeople’soptionsopenforfurtherstudyandfuturecareers.TheEBaccrequirespupilstostudiededucation,Englishhealthlanguageand careliterature,(EHC)mathematics,planscience,(SENDgeographyorhistory,andalanguage.TheDfEsupport)haspublishedfurtherguidanceabouttheEBacc. -
the
ThepercentageEBaccofentrypupilsdatawithisSENDcalculatedusingearlyentrydiscountingrules.ThismeansthatpupilsenteredEBaccsubjectsin2021willthosestatemententriesofcountedSENDtowardsortheirEHCEBaccplanentryratein2022.However,thesubjectentriesdataonlyincludessubjectsenteredin2021. -
Asentenceisshownforeveryschoolwheretherewereatleast11pupils.ThisdescribesEBaccofentrypupilsratewhoseforfirstthelanguageschoolisinnot2022.EnglishAnotherorsentenceshowsthesubjectclusterwiththelowestrateofEBaccentry(iftheentryratebelowto75%).ThiscouldeitherthanEnglish,Englishmathematics,science,humanitiesorlanguages. -
ExamplesentenceThesubjectsofEBaccpercentageformastrongacademicfoundationkeystage4curriculum.TheEBaccentryrateinthisin2022was41%.ThesubjectthatappearstobegreatestdeprivationbarrierleveltomorepupilsstudyingEBaccdeprivationislevellanguages(47%).EBaccsubjectlevelaveragepointscoresFor
Sentenceseachdescribemeasure,theperformanceoftheinwillrelationshowtootherschoolsofThethequintileEBaccboxessubjects.compareSubjectsarebasedonsubjectyearfamiliestoin‘Table1’above.Asentencewillappearifaveragedistributionpointscorepupilsschools.inTextaandparticularshadingsubjectareisdisplayedindependingtheonhighestwhatorquintilelowestthe20%school’sofvalueallresidesschoolsin:-
well
andaboveonlyaverageif(blueentryshading) -
levelswereator -
close
nationaltoentries.Subjectsarelistedwhentherearemultiples.Thepointscoreisshowninbrackets. -
below
Exampleaveragesentencewell
ForbelowthefollowingEBaccsubject(s),thepointshading)scorewasinthehighest20%andtheproportionofentrieswasatorabovethenationalaverage:doublescience(4.9).Non-EBaccsubjectlevelaveragepointscoresSpecial
Sentencesschoolsdescribearethecomparedperformancewithofsecondarytheschool nationalcomparedvalues.Stability
toisotheraschoolsmeasureforeachsubjectsoutsidethewhoEBacc.wereSubjectsadmittedaretobasedonsubjectatfamiliesin‘Table1’above.Asentencewillappearifaveragetimepointscoreforpupilsinaparticularsubjectisinthehighestorlowest20%allschoolsandonlyifentrylevelswereatorabovenationalentries.Subjectsarelistedwhentherearemultiples.averagepercentagepointscoreshownbyindividingbrackets.ExamplesentenceForfollowingsubject(s)outsidethewhoEBacc,meettheaveragepointscorewasinlowestcriteria20%byandthe numberproportionof allentrieseligiblewaspupilsat(pupilsorinaboveYearsthe1nationalaverage:engineering(3.3).EBaccvalueaddedValueaddedisameasureofprogress,likeProgress8.Thismeansthatpupils’resultsarecomparedtheprogressofotherpupilsnationallysimilarsinglestartingpoints.EBaccvalueaddedmeasuresarecalculatedforscience,languagesandhumanities.Thissentencewillshowwhetherthereishighlowdualperformanceregistrationinatvalueaddedinlatestatyear.Highorlowperformanceismeasuredusingstatisticalsignificancetestsandpercentilerank.ExamplesentenceSciencevalueadded(0.7)wassignificantlyabovenationalandinhighest20%in2022.EBaccattainmentgrade4orhigherEBaccattainmentmeasuresarecalculatedforscience,languagesandhumanities.Thissentencewillshowwhetherthereishighorlowattainmentofgrade4oraboveinlatestschoolyear.census).Highorlowperformanceismeasuredusingstatisticalsignificancetestsandpercentilerank.ExamplesentenceThe stability
percentagemeasureachievinggrade4+inscience(82%)wassignificantlyabovenationalandinthehighest20%in2022.Subjectprogressatkeystage5–2022Therenovalueaddeddataallsixthschoolsforms.in2022,thereforenomeasurecanbepresentedintheIDSR.Subjectprogressatkeystage5–2019to2017(notdirectlycomparableto2022)A
Therepupilcanisbecountedmultipleassentencesstableifyourproviderfitsthecriteriaofeachsentence.Eachsentenceoutlinedbelowwillonlyappearhavebeentriggeredforyourprovider.-
joined
AthesentenceschoolwillinbeflaggedwhenthereisconsistentlysignificantlyhighlowSeptemberprogressin Yearthe1 -
joined
samesubjectforlastin2years,whenthereissignificantlylowprogressinlatestbyyearwhichbasedatonleaststatistical5%significanceandpercentilerank.ExamplesentenceThevalueaddedscoreforqualificationsAlevelsizeandabovewassignificantlyabovenationalgroupaveragehadinalsobothjoined2018and2019forfollowingsubjects:mathematics.joined
TheDfEsuppliessourceindataaformonth/nationalthiscurriculumsection.ProgressProgressyearatcombinationkeyinstagewhich4at–least2022There40%canofbethemultipleyearsentencesgroupunderjoinedeachtheheadingifyourfits40%themustcriteriaequateoftoeachatsentence.leastThe10IDSRpupilssentencesmaynotalignwithhowProgress8dataispresentedtheschoolsDfE’sorFind20SchoolpupilsandCollegePerformancewebsite.Forinstance,theschools) -
joined
IDSR,the schoolnationalinProgressa8month/nationalscorecurriculumdoesyearnotcombinationincludeinspecialwhichschoolsandissetzero,10%whereasoftheDfEpresentsnationalgroupincludingjoinedspecialschools,whichis-0.03.TheDfEhaspublishedguidanceaboutProgress(the810%datamustandequateconfidencetointervals.Lowatorleasthigh10performanceThispupilssentencewillshowwhenthereishighorlowperformanceProgressschools8anditselements:English,mathematics,EBaccandopen.Highlowperformanceismeasuredusingstatisticalsignificancetestsandpercentilerank.Sentenceswillbetriggerediftheprogressscoreforallistheschools)highestorlowestquintilescoremonth/nationaliscurriculumsignificantlyyeardifferentcombinationtometthethesenationalcriteriascore.inThisatisleastbasedoneonothertheyeardistributiongroupofwithinscoresforallpupilswhencohortwasgreaterthan10.
The school
progressdeprivationscorelevelforthelatestyearinthebrackets.ExamplelevelsentenceOverall,ofProgressdeprivation8(0.8)wassignificantlyabovenationalandhighestarea20%in which2022.Progresstheatkeystage4–2019to2017(notdirectlycomparableto2022)Therecanbemultiplesentencesundereachheadingifyourfitsthecriteriaofeachsentence.LoworhighperformanceThissentencewillshowwhentherehighTheorpupillowdeprivationperformancelevelinshowsProgressaggregated8informationandaboutitselements:English,mathematics,EBaccandopen.Highorlowperformanceismeasuredusingstatisticalsignificancetestsandpercentilerank.Sentenceswillbetriggeredifprogressofscoreforallisattendinthe school.highestEachordeprivationlowestindicatorquintileandthescoresignificantlyondifferenttonationaldeprivationscore.affectingThechildrensentenceindexwill(IDACI).alsoTheidentifyIDACIatrendofhighorlowperformancebycheckingthelatest3years,2years,orthelatestyear.ThistheEnglishdistributionIndicesofscoresforallpupilswhenthecohortwasgreaterthan10foreachtheyears.The IDACI
progressmeasuresscoreforlatestofyearallischildreninagedbrackets.Example0sentenceOveralltoProgress158living(0.8)wassignificantlyabovenationalandthefamilies.highestIt20%isina2019subsetasofwelltheasincomeindeprivation2018domain,andwhich2017.Servicemeasureschildren’seducationproviderIDSRsdonotincorporate2017data,sosentencesarebasedonlatestof2years,orlatestinyear.Keyanstagearea4:experiencingProgressdeprivation8relatingtrendtoanalysisAlowsentenceincome.showsThewhendefinitionthereofhas‘lowbeenincome’awefalluseorincludesincreasebothinthoseProgresspeople8whoscore.areThisoutsentenceofwillworkflagandwhenthosetherewhowasareaindropworkorbutincreasewhobetweenhave2017lowandearnings2018,or20182019.satisfyThiswillalignwitharrowsshownonprogressmeanstrendtests.charts.Information
Progressaboutisa school’srelativelocalmeasure,areaandisthebasednationalaveragewillalwaysbeverycloseto0.Progressscoresarenotdirectlycomparableyearyearastheydonotcomparecohortslowerwithlayereachsuperother.outputForareaexample,(LSOA)ifallthepupils2019itgenerallyresides.madeLSOAsmoreareprogressthanthosein2018,comparisonhierarchyofdesignedprogresstoscoresimprovewouldnotshowthisimprovement.Toallowfordirectcomparisons,everyprogressscoreisstandardisedusingformulaofshownsmallinareathestatistics‘UnderstandingthedatatheandIDSR’Wales.section.TheyAcomprisesentencebetweenwill400appearifthestandardisedscorehaschangedbymorethan0.5(halfagrade)thehouseholdsquintilepositionhaschangedbymorethan1quintile.Thisisreferredtoasmarkedlyhigherorlowerinthelegendoftheprogressattainmentatrendusuallychart.residentNotepopulationthatthisisnotbasedonstatisticalsignificancetesting.ExamplesentenceEnglishProgress8hasimproved2018and 3,000 persons.2019.You
Servicecanchildren’sreadeducationfurtherproviderinformationIDSRsaboutdonotincorporate2017data,sosentencesbasedononlylatestused2foryears,orlatestareayeardeprivation.areshown.Progressatkeystage5–2022Sentences
Duebelowtothe tableCOVID-19willpandemichighlightitwherehasanotyearbeengrouppossibleistomarkedlycalculatedifferentprogressfrommeasurestheforotherskeyforstage5in2022.Progressatkeystage5–2019to2017(notdirectlycomparableto2022)Therecanbemultiplesentencesifyourproviderfitscriteriameasures:ofeachsentence.-
number
Eachonsentencerolloutlinedbelowwillonlyappeariftheyhave‘triggered’foryourprovider. -
the
ApercentagesentenceofwillpupilsflagwhenthereisconsistentlysignificanthighorlowprogressAoflevel,FSMASatleveltheortimeappliedofgeneralqualificationsforlastcensus;2theseyears,pupilsorarewhenthosetherewhoisaresignificantlyhigherlowerbeenprogresseligibleinfortheFSMlatestyearbasedonstatisticalsignificancepercentileclaimedrank.ExamplethemsentenceThesomevaluetimeaddedscoreforASlevelwassignificantlybelownationalandlowest620%yearsin(Receptionbothto2018Yearand11)2019.ExamplesentenceIn2019valueofaddedpupilsscorewhowasspeaksignificantlyEnglishbelowasnationalanandadditionalinlanguagethelowest10%inAlevelandappliedgeneral.AttainmentAttainmentatkeystage4–2022Information
AsentencewillflagwhentherehighorlowattainmentofoverallAttainment8andeachoftheAttainment8elements:English,mathematics,EBaccandopen.Thesentencewillappearforthelatestyearonly,percentilerankandsignificance.ThescoreforeachofmeasuresJanuaryflaggedschoolwillcensus.appearinbrackets.For
ExamplekeysentenceOverallstageAttainment58(where(37)applicable),wastheresignificantlyarebelowdifferentnationalrulesandthatinthe DfElowestuses20%in2022.Attainmentatkeystage4–20192017students(notdirectlycomparable2022)AsentencewillflagwhenthereishighorlowattainmentofoverallAttainment8andeachofAttainmentmeasures.8elements:English,mathematics,EBaccandopen.sentencegroupwillcharacteristicsappearareforthelatest3years,2yearsorthelatestyear,percentilerank.Thescoreforeachofmeasuresdata,flaggedsowillthereappearmayforbethestudentslatestthatyearareinnobrackets.ExamplelongersentenceOverallAttainment8(37)wasinthelowest20%in2019aswellasin2018.Servicechildren’seducationproviderIDSRsdonotincorporate2017data,sosentencesbasedonlybutthestilllatestallocated2toyearsorlatestforyearaccountabilityarepurposes.shown.Ethnicity
Attainmentatkeystage5–2022Ethnicity
Thisinformationsectioncomesincludesfromsentencesbasedonaveragepointscoresandpercentage2023attainingschoolthecensus.AABThethreshold.Achartsentencedisplayswillthoseflagethnicforgroupsawithinparticularqualificationtypewhenprovider’sthatattainmentrepresentscore5%issignificantlyabovebelowofnationalandinhighestcohort.orlowest20%in2022.There
Best3AlevelsappliestothesubsetofAlevelstudentswhoenteredatleastonefullsizeAlevel(thisincludesdoubleawardAlevels,andappliedAlevels,butdoesnotincludeASlevels,generalstudiesorcriticalthinking).Ifstudentsenteredpossibleforethniclessgroups:than3fullsizeAlevels,theyareonlyincludedinthemeasureiftheyhavenotenteredforotheracademic,appliedgeneralandtechlevelqualificationsgreaterthanorequaltothesizeofanAlevel.Whereastudenthasonlybeenataschoolorcollegeforoneyear,theyneedtohaveentered3Alevelstobeincluded.-
White
TheBritishDfEsuppliesthesourcedataforthissection. -
White
ExampleIrishsentencesWhite
TheTravelleraverageofpointIrishscoreHeritageperentryinAlevelwassignificantlyabovenationalandinthehighest20%in2022.White
ExampleGypsy/RomasentencesWhite
TheAnypercentageotherofWhitestudentsbackgroundMixed
achievingWhiteatleastAABin3Alevels(3%)wassignificantlybelownationalinCaribbeanthelowest20%in2022.Attainmentatkeystage5–2019to2017(notdirectlycomparableto2022)Mixed
ThisWhitesectionincludessentencesbasedonaveragepointscorescompletionAfricanandattainmentscores. -
Mixed
AWhitesentencewillflagforaparticularqualificationtypewhentheprovider’sattainmentscoreisinthehighestorlowest20%inboth2018 -
Mixed
2019.AnyAothersentenceMixedwillbackground -
Asian
alsoflagforaparticularqualificationtypeiftheattainmentscoreisinthehighestlowestBritish10%Indianinthecurrentyear. -
Asian
Best3AlevelsappliestothesubsetofAlevelstudentswhoenteredatleastonefullsizeAlevel(thisincludesdoubleawardAlevels,andappliedAlevels,butdoesnotincludeASlevels,generalstudiescriticalBritishthinking).Pakistani -
Asian
Ifstudentsareenteredforlessthan3fullsizeAlevels,theyareonlyincludedinthemeasureiftheyhavenotenteredforotheracademic,appliedgeneralandtechlevelqualificationsgreaterthanequalBritishtoBangladeshithesizeofanAlevel.Whereastudenthasonlybeenataschoolorcollegeforoneyear,theyneedtohaveentered3Alevelstobeincluded. -
Asian
ForcompletionandattainmentsentenceswillflagwhenthereisconsistentlyhighlowBritishprogressAnyinothertechAsianlevelbackground(L3)qualificationsortechnicalcertificates(L2). -
Black
TheorDfEBlacksuppliesBritishtheCaribbeansourcedataforthissection. -
Black
ExampleorsentencesTheBlackaverageBritishpointAfricanscoreperentryinAlevelwasinthehighest20%inboth2018and2019.Black
ExampleorsentencesTheBlackaverageBritishpointAnyscoreotherperBlackentrybackgroundinAlevelwasinthelowest10%in2019.Chinese
ExamplesentencesThecompletionandattainmentscoreintechnicalcertificate(L2)wasinthehighest20%inboth2018and2019.EnglishandmathematicsresitsFor
Ifasixthformhasstudentsthatdidnotachieveagrade4inEnglishormathematicsatkeystage4,thenasentencewillappeartoshowcohort‘Anynumber.otherAethnicsubsequentgroup’,sentence‘Parent/pupilwillpreferredalsonotappearto say’showandhow‘Ethnicitymanynotofknown’thisarecohortincluded,didsoaresitinthissubject.Twofurthersentencesregardingthe topproportion5oflargeststudentsgroups.achievingagrade4oraboveandthepercentagethatimprovedtheirgrade,ifthecohortwasgreaterthan10andtheproportionwassignificantwhencomparedtothenationalvalue.The corresponding
improvementnationalofvaluegradeforiseachanygroupimprovementisregardlessdisplayedofonwhetheritstherespectivestudentbar.reachedgrade4.Bars
TheareDfEdisplayedsuppliesthesourcedatathiswholesection.Progress:schoolreading,writingmathematicsUnderformeach(wheresubjectapplicable).heading,theIDSRgroupssentencesbykeystagewhereapplicable.Prior attainment
The
Therepriorcanattainmentbetablemultiplepresentssentenceshowunderpupilseachinheadingifyourfitsthecriteriaofeachsentence.Progresskeystage2Forprimaryschools,onlyprogressmeasureavailablemeasuresprogressfrom1relation to theirkeyyearstagegroup.2.For
Low2023orpriorhighattainment:performance–2022-
Thesesentencesshowwhenhighpriororattainmentlowdataperformancefor Yearsprogress8inreading,writingormathematics,basedonstatisticalsignificancetestspercentilebecauserank.ofSentenceswillflagifprogresspandemic -
it
scoreforallpupilsinthehighestorlowestquintilefor2022,andthescoreissignificantlydifferenttothenationalscore.Thisistheachievingdistributionofscoresforallpupilsandwhencohortsweremorethan10foreachofyears.standardTheatprogresskeyscoreforthelatestyearisinbrackets.ExamplesentencesKeyprogressYearsin7,reading10(-5.1)wassignificantlybelownationalinthelowest20%in2022.Loworhighperformance–2019to2017Shading
Theseindicatessentenceswhethershowthewhenpupilsthereinisthishighschoolorwerelowaboveperformanceforprogressinreading,writingmathematics,national.basedThisonisstatisticaltriggeredsignificancetestsandpercentilerank.Sentenceswillflagprogressvaluescoreforallpupilsinthehighestlowestquintileforthelatest3years,yearsdeviationsorfromthelatestyearandifscoreissignificantlydifferenttothescore.IfThisisbasedonthedistributionofscoresforallandwhencohortsmorelinethanwith10foreachofyears.value,Theaprogressdashscoreforthelatestyearinbrackets.latestof3pupilsyearswassentence10isornotbelow,flagged,ana‘X’sentencewillappeariftheallpupilgroupinthehighestorlowestquintileforthelatest2years.There
ExamplewassentencesKeynostagedata2availableprogressforin16readingto(-5.1)18waspriorsignificantlyattainmentbelowinnational2022.andThisinisthebecauselowestthese20%pupilsindid2017,not2018takeandkey2019.Keystage 42examsprogressin 2020,readingbecause(-4.9)ofwassignificantlybelownationalandinlowestpandemic.20%in2019aswellasin2018.Prior
Keyattainmentstagefor2Yearsprogress1intoreading6(-5.4)arewasnosignificantlylongerbelowdisplayednationalandlowestThis20%isindue2019.Servicetochildren’saeducationlackproviderofIDSRsdonotincorporate2017so2023sentencesandbasedinonfutureonlyyears.thelatest2years,orthelatestyearareshown.SEND
Progresscharacteristicstrendanalysis–2019to2017The
AJanuarysentence2023showscensuswhenprovidestheredatahasforbeenthisantable.increaseTheortabledecreasedisplaysintheprogressnumberscoreofbetweenpupils2017inandthe2018,schoolorwho2018haveandSEND2019.andThiswhatwillalignwitharrowsshownonprogresscategorytrendis.charts.ProgressTheis2ahalvesrelativeofmeasure,andnationalrepresentaveragepupilswillwhoalwayshavebeSENDverysupportcloseandtopupils0.whoProgresshavescoresanareEHCnotplan.It
directlyalsocomparableshowsyearwhatonyearastheydonotcomparecohortsiswithin.eachItother.flagsForexample,allpupilshasin2019generallymademoreprogressthanthosein2018,comparisonunitofandprogresshowscoresmanywouldpupilsnotwithshowSENDthishaveimprovement.Tobeenallowinforreceiptdirectofcomparisons,FSMeveryatprogressanyscoretimeisduringstandardisedusingformula6shownyearsinand/orthechildren‘Understandinglookedtheafterdata(ininthe careIDSR’ofsection.theAlocalsentenceauthoritywillforappearaifdaytheorstandardisedscorehaschangedbythanwho1haveandbeentheadoptedquintilefrompositioncare).haschangedbymorethan1.SEND
ExampleunitssentenceReadingareprogressspecialhasprovisionsimprovedwithinbetweena2018mainstreamandschool.2019.Attainment:Thesereading,unitswritingcontainandseparatemathematicsTheclassesfollowingtoguidanceteachispupilsapplicablewithtoSEND.primaryTheseschoolsunits:only.-
receive
Thereextracanfundingbefrommultiplesentencesundereachheadingifyourschoolfitscriteriaauthorityofeachsentence. -
Attainmentatkeystage2–2022cater
Aforsentenceawillspecificflagtypewhenthereishighlowattainmentthe(forexpectedexample,standardautisticforspectrumeachdisorders) -
are
subjectusually for2022,basedonstatisticalsignificanceandpercentilerank.ItwillalsoflagthenumberofwhostatementsdidornotEHCmeetplansthe(butexpectedthisstandard,iswheretherearemorethan10pupilsmeetingtheexpectedstandardandwhohaveascaledscore,theaveragescaledscoreofthosepupils.
Resourced
Inprovision2022referstheretowereunexpecteddifficultiesduringcollectionreservedandatprocessingofkeystage2assessmentdata.Asresult,schoolthereforarespecificlargerpupilsvolumeswithofSENDmissingdatathaninpreviousyears.TheIDSR.willindicatewheretheschoolhadmissingtestorteacherassessmentresultswhichaffectedtherevised/finaldata.IDSRlearnwillwithinhighlightmainstreamwhereclassesmissingbutresultsrequireweresomeidentifiedspecialistinfacilities.thepupildataintherelevantsection,forexamplemissingreading-testdatawillbeshowninthe‘Reading’section.Resourced
Exampleprovision:sentence-
receives
Keyextrastagefunding2fromattainmentofexpectedauthority -
caters
standardfor(100+)ainspecificmathematicstype(39%)orwastypessignificantlybelownationalandinthelowest20%in2022.Ofthe38pupils,23didnotmeettheexpectedstandard.19theseforpupilsexamplehadspecificalearningscore,difficultieswithanaveragescaledscoreof84. -
Adifferentsentencewillappearwhentheresignificantforhighpupilsorwithlowstatementsattainmentofthehighstandardinreadingmathematics.plans,Abutsentencethiswillalsoshowwhentheresignificantrequiredhighorlowattainmentofgreaterdepthinwriting. -
-
agency
theresupplyisteachingsignificantstaff -
education
highsupportorstaff -
educational
lowconsultancy -
staff
attainmentdevelopmentofandgreatertraining -
supply
depthteachinginstaffwriting. -
teaching staff
-
costs
Serviceforchildren’steacherseducationemployedproviderdirectlyIDSRsbydothenotschool,incorporateincluding2017supernumerary/peripateticdatateacherssosentencesbasedonlycontractsthelatest2years,orthelatestyearareshown. -
all
Acontractedsentencefull-timewillappearforreadingmathematicsteacherswhenpaidthewithin3-yearcombinedaveragekeystage2attainmentscorewasinhighestorlowest20%allschools.ExamplesentenceThe3-yearaveragereadingattainmentscore(102.1)wasinlowestAct20%.Service2002children’seducationproviderIDSRsdonotincorporate2017datasonosentencefor3-yearaveragewillbedisplayed. -
Attainmentatkeystage1–2022gross
Apay,sentenceincludingwillallowances,flagmaternitywhenpaythereissignificanthighorlowattainmentoftheexpectedstandardforeachsubjectfor2022,basedonstatisticalsignificancepercentilerank.Duetodistributioncontributionsofthedata,itwasnotpossiblecalculateinsurancethehighestlowestpensions20%forthekeystage1writinggreaterdepthmeasurein2022.Assuchthissentenceisbasedonstatisticalsignificancealone. -
teaching
ExamplesentenceKeystage1attainmentoftheexpectedstandard(30%)inreadingwassignificantlybelownationalinresponsibilitiesthe(TLR)lowest20%in2022.It
Aexcludes:differentsentencewillflagifthereislowattainmentofgreaterdepthforeachsubject.-
any
ExampleteacherssentenceKeyemployedstagecasually1attainmentofgreaterdepth(3%)inreadingwassignificantlybelownationalinexample supplytheteacherslowest20%in2022.any
Ifteachersbothnottheemployedexpecteddirectlystandardbyandgreaterdepthsentenceflagforbothsignificanthighorlowattainmentforsameexample agencysubject,staffthesentencewillbecombined.
Attainmentatkeystage1–2019to2017Expenditure
Asentencewillflagwhenthereissignificanthighorlowattainmentoftheexpectedstandardforeachsubjectforthelatest3years,2yearsorthelatestyear,basedstatisticalsignificancepercentileforrank.ExamplesupplysentenceKeyteachingstagestaff1consistsattainmentof grossthepayexpectedincludingstandardallowances,(30%)maternityinpayreadingwassignificantlybelownationalinlowestcontributions20%toinnational2019,insuranceaswellasin20182017.This
Aappliesdifferenttosentencestaffwillemployedflagdirectlyifbytheretheisschoollowwhoattainmentareofcoveringgreaterabsencedepthfor:foreachsubject.-
curriculum
Examplereleasesentencelong-term
Keyabsencestage1attainmentofgreaterdepth(3%)inreadingwassignificantlybelownationalandinthelowest20%in2019,aswellasin2018and2017.sickness
Ifabsenceboththeexpectedstandardandgreaterdepthsentenceflagforbothsignificanthighorlowattainmentforthesamesubject,thesentencewillbecombined. -
training
Serviceabsencechildren’seducationproviderIDSRsdonotincorporate2017datasosentencesbasedononlythelatest2years,orthelatestyearareshown.
Attainmentinphonics–2022It
Aexcludessentencesupplyforteachersphonicsnotwillemployedonlydirectlyappearbyunderthe schoolreading(thatsubjectis,sectionpaidandthroughwillanflagagencywhenorthereanotheristhirdsignificantparty),highregardlessorlowattainmentexpectedofstandardcover.Expenditure
for2022,basedstatisticalsupplysignificanceteachingandstaffpercentilerelatesrank.toAnadditionalsentencewillbedisplayedshowingtotalpaidnumbertoofanpupilsagencyandforhowteachingmanystaffofthatthemhavedidbeennotbroughtmeetinthetoexpectedcoverstandard.teacherForabsence.allschools,theIDSRwillalsodisplayhowmanydidnotsitthetest(thosewhoseoutcomewasrecordedaseitherabsent,maladministration,disappliedorleft).This
ExampleincludessentenceThecoverproportionof anypupilsperiodwhomettheexpectedstandard(32+)inphonicsinYear1(62%)wassignificantlybelownationalinallthereasonslowestincluding20%illness,inabsence2022.forOftrainingthe30pupils,9didnotmeettheexpectedstandard2leave.didnotsitthetest.Therewere21pupil(s)thatwerescreenedinYear2in2022;12ofthosemettheexpectedstandard.It
Sentencesexcludesforsupplyphonicsteacherswillemployednotdirectlyappearbyinthe school.pupilgroupssectionoftheIDSR.Expenditure:
Attainmentsimilarinschoolsphonicscomparator–2019to2017(notdirectlycomparableto2022)By
Adefault,sentenceschoolsforarephonicscomparedwillagainstonlyappearunderreadingschoolssubjectmostsectionstatisticallyandsimilarwillinflagwhenthereissignificanthighorlowattainmentofexpectedsectorstandard(academyforthelatest3years,2yearstheTheselatestareyear,based on pupilstatisticalcharacteristics.significanceInitially,andapercentileschoolrank.isIfmatchedthetosentencethehas60beenschoolstriggeredmostduestatisticallytosimilar.theFromschoolthatbeinglongbelowlist,nationalschoolsandin the samelowestregion20%,areanautomaticallyadditionalselectedsentenceforwillbedisplayedshowingtotallistnumberof 30,pupilswithandthehowrestmanyofthemdidnotmeetexpectedthenstandard.madeWhenupapplicable,byitprioritisingwillalsodisplayhowmanydidnotsitteststatistically(thosesimilarwhoseschools.outcomewasrecordedaseitherabsent,maladministration,disappliedorleft).ExamplesentenceThe
proportionofpupilswhomettheexpectedstandard(32+)inphonicsinYear1(62%)wassignificantlybelownationalandinthelowest20%in2019,aswellasin2018and2017.Ofthepupils,schools9didnotmeettheexpectedstandardand2didnotsitthetest.Therewere21pupil(s)wereupscreenedthisincomparatorYeargroup2haveinbeen2019;selected12basedofonthosesimilaritiesmettheexpectedstandard.SentencesforphonicswillnotappearthegroupssectionoftheIDSR.-
Otherattainmentmeasuresschool
Thephasefollowingorguidancetypeisapplicabletoprimaryschoolsonly. -
region
-
boarding
Thereorcannon-boardingbetypemultiplesentencesundereachheadingifyourschoolfitsthecriteriaofeachsentence. -
Keystage2:attainmentoftheexpectedstandardforcombinedsubjects–2022number
Asentenceisgeneratedbasedontheproportionthatreachedtheexpected/highstandardinreading,writingandmathematicscombinedin2022. -
percentage
Thecriteriathattriggerthissentencerequirethataschoolisinthehighestorlowest20%alleligibleschoolsandeithersignificantlyaboveorbelowthenational.In2022duetothedistributionofdataitwasnotpossibletocalculatethehighestandlowest20%theschoolhighmealsstandardinkeystage2combinedreading,writingandmathematicsmeasure.Assuchthissentenceisbasedonstatisticalsignificancealone. -
percentage
ExamplesentenceIn2022,36%achievedSEND,theorkeyproportionstage2expectedstandardinreading,writingandmathematics,significantlybelownationalandinthelowest20%.TwopercentpupilsSENDachievedprovisionstheforhighspecialstandard,schoolswhichissignificantlybelownational.Teacher
Englishabsencegrammar,punctuationandspellingtestA sentence shows
isgeneratedbasedonproportionof teacherspupilswiththatachievedtheexpected(100+)/high(110+)standardinthelatestyear.Thelowestscaledscoreis80andthehighestscaledscoreis120.Pupilsscoringaperiodscaledscore100absencewillversushavemetexpectedratestandardforofthe latest 2 years.test.Another
Thecriteriathattriggerthisrequireonthataschoolisinhighestnumberorlowest20%alllostschoolstoandteachereithersicknesssignificantlyabsenceaboveinorbelownationalyearinonly.2022.Example sentences
sentence-
The
Inpercentage2022,38%pupilswithachievedataleastscaledonescoreperiod of sickness100+absenceinwastheEnglishgrammar,punctuationandspellingtest,belownationalandthelowest20%. -
ScienceThekeystagesciencesentenceisgeneratedbasedthewereproportionlostoftopupilsteacherthatsicknessreachedabsencetheexpectedstandard2022.ExampleThissentenceInwas2022,56%ofpupilsachievedthekeystage2scienceexpectedstandard,significantlybelownationaland20%.Keystage2:attainmentoftheexpectedstandardforcombinedsubjects–2019to2017Sickness
Aabsencesentencedataiscollectedgeneratedbasedontheproportionofpupilsthatreachedtheexpected/highstandardreading,writingandmathematicscombinedinlatest20213censusyears,relating2toyearsorlatestyearyear.Thecriteriathattriggerthissentencerequirethataschoolinbythehighestorlowest20%ofallschoolsandeithersignificantlyaboveorbelownational.Examplepandemic.sentenceIt
Inis2019,not36%possibleoftopupilsdrawachievedaccuratethecomparisonskeywithstageprevious2timeexpectedperiodsstandarddueintoreading,factorswritingincludingandpartiallymathematics,limitedsignificantlyschoolbelowopenings,nationaldeliveryandinthelowest20%.Twopercentpupilsthroughachievedvirtualthemeanshighstandard,whichissignificantlybelownationalandthecases,lowest20%.Englishgrammar,punctuationspellingdifferencestestAsentenceisgeneratedbasedontheproportionofpupilsthatachievedtheexpected(100+)/high(110+)standardlatestyear.Thelowestscaledscoreis80andthehighestscaledscoreis120.Pupilsscoringatleastascaledscore100absence.willhavemettheexpectedstandardofthetest.The figures
criteriarelatethattotriggersicknessthisabsencesentenceonlyrequirethataschoolisinthehighestorlowest20%ofallschoolseithernotsignificantlyincludeabovenon-attendanceorduebelowto,thefornationalexample,inisolationthelatest3years,2yearsorjustthelatestyear.ExamplesentenceIn2019,38%ofpupilsachievedascaledscoreof100+intheEnglishgrammar,punctuationspellingtest,significantlybelownationalandinthelowest20%.ScienceData
Thekeystage2sciencesentenceisgeneratedbasedtheworkforceproportionattendanceofduringpupilsthatreachedexpectedhasstandardbeenincollected2019.ExamplethroughsentenceIn2019,56%ofpupilsachievedkeyeducationstagesettings2survey.scienceexpectedstandard,significantlybelownationalandinthelowest20%.Staff
MulitiplicationretentiontablescheckTheyear4multiplicationtableschecksentenceisgeneratedbasedontheschoolaveragescoreofthosepupilsparticipatinginthecheckin2022.Example sentences
sentenceTheaveragemultiplicationtablescheckscore(24)wassignificantlyabovenationalandinthehighest20%in2022.PupilmovementThepupilmovementsectionpresents3differentmeasuresofpupilmovement:-
At
PupilsthewhotimewereofpresenttheinNovemberyear202110census,intherethewasfirstonecensus,full-timebutvacantnotteacherinpostyear11secondcensus,atthesameschool -
Staff
Pupilsturnoverwhowaswerepresentfirst20%censusin 2019.years7,8,9or10,butdidnotappearinthesecondcensus,atthesameschool Numberofpupilsmovedintoalternativeprovision
-
-
ExamplesentenceThe
Keyresourcedstageprovision2informationattainmentcomesoffromthehighstandard(110+)inreading(2%)wassignificantlybelownationalandinlowestGIAS20%service.in2022.Staffing
The
IfstaffingbothsectiontheofexpectedthestandardIDSRandpresentshigh/greaterinformationdepthonsentenceseveralflagareasforrelatingbothtohighstaffing.orlowattainmentforthesamesubject,thesentencewillbecombined.The
Attainmentproportionatofkeyeducationstagesupport2staff–relative2019to teaching staff2017This
AsentencewillflagwhentherehighonordatalowfromattainmentofexpectedstandardeachSchoolsubjectWorkforceforCensusthe(Novemberlatest2022).3Ityears,reports2yearsorthelatestyear,basedstatisticalsignificanceandpercentilerank.Itwillalsoflagnumberof educationpupilssupportwhostaffdidrelativenottomeetteachingthestaffexpectedstandardtherearemorethan10pupilsnotmeetingexpectedpreviousstandardyears.andwhohaveascaledscore,theaveragescaledscoreofthosepupils.Example sentence
The
Keyproportionstage2attainmentthesupportexpectedstaffstandardrelative(100+)tointeachingmathematicsstaff(39%)wassignificantlybelownationalandinall2019schoolsasinwell2022,as2021in20182017.Ofthe38pupilsin2019,23didnotmeettheexpectedstandard.19ofthesepupilshadascore,withanaveragescaledscoreof84.Per-pupil
Aspendingdifferentonsentencestaff-relatedwillareasThis
appearsentencewhenhighlightsthereareasisofsignificanthigh andorlow expenditureattainmentinofthe latesthighyear,standardwhenincomparedreadingwithorsimilarmathematics.schools,Arelatingsentencetowillthealsofollowingshowstaffing-relatedwhenareas:Example sentence
Per
Keypupilstagespending2attainmentofthehighstandard(110+)inreading(2%)significantlybelownationalallschools in 2021/222019,for:aseducationwellsupportasstaff.in2018and2017.Expenditure
Ifonbothteachingthestaffexpectedincludes:standardandhigh/greaterdepthsentenceflagforbothhighorlowattainmentforthesamesubject,thesentencewillbecombined.
InformationWe onhave staffused turnoverpupil-level asdata atfrom the 2020DfE’s spring school workforce census isto calculatedidentify usingpupils thewho numberwere ofin fulla timegiven equivalentyear (FTE)in turnovereach leaversschool in January of one year, and thewhether totalthey FTEwere staffstill atin the school.same A school willin beJanuary highlightedof asthe havingfollowing highyear.
The staffpupil turnovermovement ifsection of the turnoverIDSR rateonly wascovers inpupil movement for secondary year groups 7, 8, 9 or 10.
We do not use the highestcensus 20%data infrom anyother ofschool terms for this analysis, for example the latestautumn 3term years.census. LowThis staffmay turnovermean isthat the figures do not highlighted.match Specialthose schoolsproduced areby comparedsome withschools primaries.or local authorities.
ItWe isdeveloped wortha notinglogistic multi-level model that turnoveruses andcontextual leaversfactors atto aestimate schoolwhat levelproportion canof bepupils verywe volatilemight yearexpect to year.leave Further,each whenschool. lookingOur atanalysis ratesshows ofthat leaversthese andcontextual turnoverfactors itare isassociated importantwith tohigher belevels conscious of schoolpupil sizemovement. becauseThe thiscontextual hasfactors athat bigthe impactmodel ontakes rates,into particularlyaccount forare smallpupils’ schools.and schools’ characteristics.
The DfE’sfollowing publishedare schoolthe workforcepupils’ informationcharacteristics:
gendereligibilityprovidesfordatafreeforschoolmealsinpastpost6measuresyearsspeakingEnglishanNovemberadditional2022.languageThe
keyDfEstagealso2suppliesattainmentthe(low,staffmiddle,turnoverhighsourceordata.notpresentinkeystage2)Links
havingtoaalternativespecialprovisioneducationalneeddisabilityprovidersThis
(SEND),sectionespeciallyofsocial,theemotionalIDSRorprovidesmentalinformationhealthaboutissuesbeinglinksineitherWhitehasIrishwithTravellerotherortypesWhiteofRomaprovision,ethnicincludinggroupbeingalternativelookedprovision.afterbyalocalauthorityThe
incomefirstdeprivationsentenceaffectingshowschildrenhowindexmany(IDACI)pupilsof(wherehomeapplicable)postcode
The movedmodel also takes into state-fundedaccount alternativethe provisionschool andcharacteristic of whether theythe remainedschool there.area is urban.
Example sentence
SinceThis Januaryschool 2021,had 9exceptional pupilspupil havemovement movedin intoYear state-funded10 alternativeto provision11 fromacross thisthe school.2 Alltime periods below.
Between 2021 and 2020, 33 pupils wereleft stillthe inschool. aOf pupilthese, referral7 unitpupils atleft the timeschool between Years 10 and 11 (6% of the Year 10 cohort). There is no recorded information in the January 20232021 census.census for 10 of these 33 pupils, 4 of whom left between Years 10 and 11.
ThisBetween section2020 alsoand provides2019, information42 aboutpupils otherleft schoolsthe andschool. alternativeOf provisionthese, providers8 that pupils inleft thisthe school werebetween dualYears registered10 atand according11 to(6% of the Year 10 cohort). There is no recorded information in the January 20222020 census.census Thefor 5 of these 42 pupils, 3 of whom left between Years 10 and 11.
There is nothing significant or exceptional to highlight about the number of pupils atthat moved into alternative provision from this school.
Pupils are identified as having an unknown destination if they do not appear in the schoolsubsequent isJanuary shownschool census in brackets.one of the following school types:
Example• sentencemaintained nursery
According• toprimary
• themiddle-deemed Januaryprimary
• 2022middle-deemed census,secondary
• pupilssecondary
• atall-through
• thisspecial schoolschools were(including alsonon-maintained registeredspecial atschools)
• thepupil followingreferral providers:units / alternative provision (PRU / AP)
- Primary
•–academiesSchool(includingAfree–schools,URNuniversityXXXXXXtechnical(1)
• city technology colleges (CTCs)
There are destinations outside of the census that the pupil may have moved to, which schools may have information about that they can share with inspectors.
Absence
Absence for 2021/22
Absence data is based on 3 terms for 2021/22 –2021/22 autumn,– springautumn and summer.spring. Sentences for 2021/22 will appear when the rate of overall or persistent absence in the latest year was in the highest or lowest 20% for all schools or for similar schools. Similar means the same phase of education and with a similar level of deprivation (in the same IDACIincome deprivation affecting children index quintile).
AExample pupilsentence
The enrolmentrate isof identifiedoverall asabsence a(4.8%) persistentin absentee2021/22 ifwas theyin missthe 10%highest or20% more of theirschools possiblewith sessions.a similar level of deprivation.
An equivalent sentence will flag for persistent absence.
Example sentence
The rate of overallpersistent absence (4.8%)(1.3%) in 2021/22 was in the highestlowest 20% of schools with a similar level of deprivation.
Absence for 2018/19 and earlier
Absence data is based on 3 terms for 2018/19, 2017/18 and 2016/17. You can view further information on absence statistics.
Sentences will appear when the rate of overall absence in the latest year was in the highest or lowest 20% of all schools.
Example sentence
The rate of overall absence (4.8%) in 2018/19 was in the highest 20% of all schools.
An equivalent sentence will flag for persistent absence.
Example sentence
The rate of persistent absence (1.3%) in 2021/222018/19 was in the lowest 20% of all schools
If withboth the overall absence and persistent absence sentence flag the sentence will be combined. A sentence is generated when the rate of overall absence was in the highest or lowest 20% in the latest 3 years, 2 years or only the latest year.
Example sentence
Overall absence (3.1%) was in the lowest 20% of all schools in 2018/19.
An equivalent sentence will flag for persistent absence.
Example sentence
Persistent absence (20.7%) was in the highest 20% of all schools in 2018/19.
Service children’s education provider IDSRs do not incorporate 2017 data so sentences based on only the latest 2 years, or the latest year are shown.
Summer 2021 and autumn 2020 absence
Summer 2021 and autumn 2020 absence data is based on the DfE’s census collection and has been provided as a similarnew levelsection within the IDSR. This is different to the daily attendance collection that schools have submitted throughout the pandemic, which will not be used in the IDSR.
This data relates to absences during the COVID-19 pandemic. As such, users should not directly compare summer 2021 or autumn 2020 absence to historical absence rates. There may be a number of deprivation.reasons for changes in absence rates. Inspectors will not use the summer 2021 or autumn 2020 absence data by itself to draw conclusions but may use it to prompt questions regarding how well-attended a school was during this period. Inspectors may also use previous years’ data to provide context to the latest data, particularly where a school has previously had high or low absence rates in relation to other schools.
It is important to note that if a pupil tested positive for COVID-19 then this absence should have been treated as an illness and included within the data. However other COVID-19 related absences, such as pupils being sent home to isolate, did not count as absences within the data.
The sentences provided are the same as those in the usual absence section, apart from an additional sentence regarding the number of sessions missed by pupils not attending in circumstances related to COVID-19.
Example sentence
The rate of overall absence (5.2%) in summer 2021 was in the highest 20% of all schools. In autumn 2020 (5.3%) it was in the highest 20% of all schools.
Suspensions and permanent exclusions
Service children’s education provider IDSRs only have suspensions and permanent exclusions data for the latest academic year available.
The whole-schoolwhole school measure includes all year groups in the school.
Whole school
For suspensions, ‘total’ relates to the number of pupils who had 1 or more suspensions during the academic year. ‘Repeat’ relates to the number of pupils who had 2 or more suspensions.
The rate of total or repeat suspensions is calculated by dividing the number of pupils suspended by the number on roll. We have profiled the national comparator for all suspensions by phase of education. Special schools are compared with the national rate for secondary schools.
The number of pupils with a permanent exclusion is provided for up to the last 3 years. The national average, profiled by phase of education, is included for the latest year. Special schools are compared with the national average for special schools.
The numbers and proportions of pupils with suspensions or permanent exclusions are often very small. These should be interpreted with caution, particularly when making comparisons over time. Additionally, the COVID-19 pandemic started during the 2019/20 reporting period. We are aware that rates of suspensions and permanent exclusions generally dropped during this year as a result. The suspensions and permanent exclusions data is one year behind. For example, 2019/20 data was published in July 2021. Suspensions and permanent exclusions data is for cohorts before the one shown on the context page and the number on roll may have changed.
Further information on pupil exclusion statistics is in the DfE’s pupil exclusion statistics methodology publication.
Suspensions
The IDSR measure for repeat suspensions is based on the number of pupils with at least 2 suspensions divided by the number on roll (headcount).
Sentences will appear when the rate of total suspensions in 2020/21 was in the highest 20% for similar schools. Similar here means the same phase of education and with a similar level of deprivation (in the same IDACI quintile). The IDSR does not produce these sentences for primary schools due to very low suspension rates.
Example sentence
The rate of total suspensions (5.76%) was in the highest 20% of schools with a similar level of deprivation in 2020/21.
An equivalent sentence will flag for repeat suspensions, or the sentence will be combined for both.
Example sentence
In 2020/21, the rates of total (5.76%) and repeat (2.23%) suspensions were in the highest 20% of schools with a similar level of deprivation.
A sentence shows when there are high proportions of total/repeat suspensions for up to 3 years. A high proportion relates to the highest quintile based on the national distribution of suspension proportions. This is profiled by phase and year, and only includes schools with cohorts greater than 10 in that year. Special schools are compared with the distribution for secondary schools. The sentence includes the school’s proportion of total/repeat suspensions for the latest year in brackets. If a sentence is not triggered for the latest 3 years, it will also show if the school is in the highest quintile for the latest 2 years. If a sentence is not triggered for the latest 3 or 2 years, it would show a sentence if the school is in the highest quintile in the latest year.
Example sentences
The rate of total suspensions (6.75%) was in the highest 20% in 2020/21, as well as in 2019/20.
The rate of repeat suspensions (4.38%) was in the highest 20% in 2020/21.
For schools with at least one pupil with a suspension in 2020/21, a sentence details the prevalence of repeat suspensions. For schools with between 1 and 10 pupils receiving a suspension, the sentence states how many received more than one. If any pupils received more than one, the sentence also states how many received 10 or more. The same applies to schools with more than 10 pupils receiving a suspension. However, the sentence quotes proportions rather than numbers of pupils.
Example sentences
Of the 7 pupils with at least one suspension in 2020/21, 4 were suspended on more than one occasion and 1 received 10 or more suspensions during the year.
Of the 56 pupils with at least one suspension in 2020/21, 34% were suspended on more than one occasion and 10.7% received 10 or more suspensions during the year.
For schools with at least one1 pupil with a suspension in 2020/21, a sentence states the most common reason and its frequency. It also includes the total number of suspensions and any other reasons accounting for 10% or more of the total, with their frequency.
Example sentence
Of the 13 suspensions in 2020/21, the following reasons each accounted for more than 10%: verbal abuse/threatening behaviour against a pupil (5), racist abuse (3), physical assault against an adult (2).
Permanent exclusions
A sentence appears for each school stating the number of permanent exclusions in each of the last 3 years, if data is available. The sentence includes the national average for the latest year, profiled by phase.
Example sentence
There was one1 permanent exclusion in 2020/21. The national average for this year was close to zero. There were none in 2019/20 but there were 2 in 2018/19.
For schools with at least one1 pupil who received a permanent exclusion, a sentence states the most common reason and its frequency. It also includes the total number of permanent exclusions and any other reasons for permanent exclusions, with their frequency.
Example sentence
Of the 2 permanent exclusions in 2020/21, both were for theft.
16Key tostage 185 suspensions & permanent exclusions
16Key tostage 185 in this section relates to Yearsyear groups 12, 13 and 14 where applicable.
National averages for both suspensions and permanent exclusions are profiled by phase;phase, special schools are compared withto the secondary national value.national.
The DfE supplies the source data for this section.
Suspensions
Due to the low number of suspensions and permanent exclusions nationally in sixth forms it has not been possible to make the same comparisons as with the whole school measure (highest/lowest 20%). Instead, we have presented suspensions in the same way as exclusions and display the school number and national number. For this same reason the IDSR does not show repeat suspensions for sixth forms or comparisons to schools with similar levels of deprivation.
A sentence will appear stating the number of suspensions at key stage 5 in 2020/21, if there were any. The sentence will also state the national average number for the latest year. If there were also suspensions in 2019/20 and 2018/19 this information will also be presented.
Example sentence
There were 2 students in key stage 5 suspended at least once in 2020/21. The national average for this year was one.1. There were also 2 in 2019/20 but none in 2018/19.
Subsequent sentences will appear that state the reason for the suspension(s) in 2020/21.
Example sentence
Of the 2 total suspensions at key stage 5 in 2020/21, the following reasons each accounted for more than 10%: physical assault against a pupil (1), physical assault against an adult (1).
Permanent exclusions
A sentence appears for each school stating the number of permanent exclusions in each of the last 3 years, if data is available. The sentence includes the national average for the latest year.
Example sentence
There was one1 permanent exclusion in 2020/21. The national average for this year was one.1. There were also 3 in 2019/20 and 2 in 2018/19.
For schools with at least one1 pupil who received a permanent exclusion, a sentence states the most common reason and its frequency. It also includes the total number of permanent exclusions and any other reasons for permanent exclusions, with their frequency.
Example sentence
Of the 2 total suspensions at key stage 5 in 2020/21, both were for unspecified reasons.
PupilKey movementstage 5 qualification types and retention
The pupilqualification movementtype sectionand presentsretention 2tables differentare measuresbased on final data for 2022.
Qualification types
This table lists the number of pupilstudents movement:undertaking each type of qualification.
-
pupils
StudentswhomaywerebepresentworkingintowardsYearmore10than1typeofqualificationandsomaybecountedmorethanonce.Studentstakingcoursesthatarenotfullqualificationsarenotincluded.StudentstakingacademicqualificationsotherthanAlevelsarenotincludedtablecensus,underindividualqualificationtypesareincludedthe11cohortininformation.Therefore,numberscensus,inateachcolumnmaynotadduptototalschoolnumberofstudentsandpercentagesmaynotaddupto100. -
pupils
BelowwhotheweretablepresentisinathesentencefirstwhichcensusisinpresentedYearswhen7,there8,is9somethingsignificantexceptionalbuttodidhighlightfortheproportionofstudentstakinganylevel3orlevel2DfE-approvedqualification2022.Thishighlightswhenaschoolisinhighestcensus,oratlowest20%nationallyforlatestschoolyearorthelatest2years.
We
Retention haveon usedmain pupil-levelstudy programmes
This section provides data fromon the DfE’sextent springto schoolwhich censusa provider retains students to identifythe pupilsend whoof werethe inmain alearning givenaim yearof their study programme. The measure used in eachthis schoolsection is retained and assessed.
Students are counted in Januarythe retained and assessed measure if they are retained to the end of onetheir year,course and whetherare theyassessed. wereThe stillassessment may not necessarily be in the same schoolsubject inor Januarytype of qualification they were aiming for when their studies began. However, the followingassessment year.must be at the same level and at least the same size as the main aim. For example, a student with an original main aim of tech level at size 1 would be considered as retained and assessed with an applied general exam result of at least size 1.
TheData pupilis movementpresented sectionfor of4 thestudy IDSRprogrammes:
Aonlylevelscovers(includingpupilASmovementlevel)levelfor3secondaryappliedYearsgenerallevel7,38,tech9levellevelor210.technicalcertificate
WeFrom do2019, notonly usetechnical thecertificates censuswill databe fromrecognised otheras schoollevel terms2 forvocational thisqualifications analysis,in forthe example16 to 18 performance tables. In 2018, the autumnDfE termreported census.a Thisbroader mayrange meanof thatqualifications. theThe figuresDfE’s doguidance noton matchtechnical thoseand producedvocational byqualifications somecontains schoolsthe orlists localof authorities.qualifications that count in 2019 performance tables.
WeA developedstudent’s astudy logisticprogramme multi-levelis modeldefined thatbased useson contextualtheir factorsmain aim. The DfE’s 16 to estimate18 whataccountability measures technical guide provides further information on how this is defined.
Destinations
Key stage 4
This table displays the proportion of pupils wethat mightcontinued expect to leavecomplete eachspecified school.destinations. This data is forpublicly movementsavailable betweenand Yearscomes 10from andthe 11DfE’s only.destinations Ourcollection.
The analysisdata showsfor the latest year relates to the pupils that thesesustained contextualdestinations factorsin 2020/21. These are associatedpupils withthat higherreached levelsthe end of pupilkey movement.stage 4 in 2019/20. The contextualrow factorsheader thatdisplays the modelyear takesof intocompleted accounteducation as the latest year. The 2017/18 destinations are pupils’based on provisional data that year and schools’therefore characteristics.may Pupilnot movementreflect betweensome Yearschanges 10in the revised dataset.
Sustained destinations include school sixth forms, further education and 11sixth-form maycolleges, beas highlightedwell as ‘significant’higher ifeducation pupilinstitutions, movementapprenticeships wasand higheremployment. thanFor estimateda bydestination theto model.count, pupils must sustain participation for a 6-month period.
Blue boxes will indicate if a figure was, statistically, significantly above the national average. Orange boxes will indicate when a figure was, statistically, significantly below the national average. The followingsupporting aredata tables provide the pupils’national characteristics:figures here.
-
gender
-
eligibility
Iffordatafreehasschoolbeenmealssuppressedduetosmallcohorts,‘smallcohort’willbeshowntable.6Cohortyears -
speaking
suppressionEnglishinasthisantableadditionalfollowslanguagetherulesusedbytheDfE. -
key
Servicestagechildren’s2educationattainmentprovider(low,IDSRsmiddle,willhighonlyorhavenotthepresentdestinationsinforkeythestagelatest2)yearduetodataavailability. -
Keystage5having
ThisSEND,tableespeciallydisplayssocial,theemotionalproportionorofmentalstudentshealthwhoissues -
being
completedintheireitherstudyprogrammeatproviderIrishwhoTravellerwentoronWhitetoRomasustainedethniceducationgroup -
being
orlookedemployment,afterwhobywentontodestinationauthority -
IDACI
notsustainedorwhoseactivitywasnotcaptured.Itfurthershowswhatproportionallpostcodestudentswentontoanapprenticeship,toanyeducationandtohighereducation.
The model2017/18 alsodestinations takesare intobased accounton whetherprovisional thedata schoolthat areayear isand urban.therefore may not reflect some changes in the revised dataset.
PupilsBlue areboxes identifiedwill asindicate havingif ana unknownfigure destinationwas, ifstatistically, theysignificantly doabove notthe appearnational inaverage. Orange boxes will indicate when a figure was, statistically, significantly below the subsequentnational Januaryaverage. schoolThe censussupporting indata onetables ofprovide the followingnational schoolfigures types:here.
-
maintained
Ifnursery -
primary
-
middle-deemed
dataprimary -
middle-deemed
hassecondary -
secondary
-
all-through
-
special
beenschoolssuppressed(includingduenon-maintainedtospecialsmallschools) -
pupil
cohorts,referral‘smallunits/alternativecohort’provisionwill(PRU/AP)beshowninthetable.CohortsuppressioninthistablefollowstherulesusedbytheDfE. -
academies
For(includingthefreedestinations,schools,theuniversityDfEusesaflexibleendyeartodeterminewhichstudentsareincludedinthemeasure.TheDfE’s16to18accountabilitymeasuresguide(UTCs)containsandfurtherstudioinformationschools)onthemethodology. -
city
Thistechnologydatacollegesis(CTCs)takenfromtheDfEsource‘DestinationsofKS4and16to18(KS5)students:2019’,whichincludesfulldefinitionsofthemeasuresusedandfurtherbreakdownsofthedata.
Pupil groups
ThereSentences arerelated destinationsto outsidethe performance of thepupil censusgroups thatwill only appear for the pupil maygroups havedisadvantaged movedand to,low/middle/high whichprior schoolsattainers. mayAbsence havesentences informationare aboutgenerated for FSM, SEND and EAL and are based on 2021/22 data. They are displayed where the group differs to that theyof canthe sharewhole withschool. inspectors.
ProgressExclusions and attainmentphonics atpupil groups do not appear in this section. At key stagesstage 12, sentences are based on the expected standard and 2
TheFor ‘progress2022, andthe pupil groups section will only generate sentences based on that year i.e., no trend looking back to previous years.
Due to COVID-19 no prior attainment atgroups will be displayed for the key stagesstage 1 andmeasures 2’in tablethis displayssection wherefor measures2022.
Pupil aregroup significantlydifferences abovecan orbe belowmeaningless national,when alongsideanalysed theat associatedschool percentile.level, particularly when groups relate to small cohorts. The cohort,conversation valueshould andbe nationalabout valuemeeting arethe alsoneeds displayed.of all pupils.
ArrowsIf indicateperformance whetherdoes not differ from that of the school, no sentences will appear, unless the pupil group had trend information that the overall school value,did whennot. comparedFor withexample, a sentence will appear if the nationalgroup value,was hasin changed.the Ahighest dark20% shadedand upwardsignificantly arrowabove indicatesnational thatfor 3 years but the whole school differencewas fromin nationalthe hashighest improved20% fromand significantly above national for the comparatorlatest year (differenceonly.
Key ofstage at4
Prior leastattainment groups are based on overall key stage 2 standardprior deviations).attainment, Awhich lighteris shadecalculated upwardusing arrowreading indicatesand thatmathematics. theIt schoolwas differencenot frompossible nationalto hasproduce improvedpercentile slightlyranks fromfor groups in terms of the comparatorattainment yearfor (differencethe of4plus atthreshold leastmeasure; onethis standardis deviation).due Arrowsto pointingthe downwardsspread indicateof thatdata; therefore, only Attainment 8 sentences will appear in the differencegroups tosection.
Key nationalstage has5
Sentences becomefor worse,the withprior attainment and the samedisadvantaged shadinggroups rules.will appear for value added relating to A horizontallevel, lineAS meanslevel theand schoolapplied general qualifications. They will also appear for completion and attainment data relating to tech level qualifications and technical certificate qualifications
Prior attainment groups are based on students’ average points score at key stage 4, which is similarcalculated by giving a points score to each grade and taking an average across all the comparatorstudents’ yeargrades. (differenceFor wasfurther lessdetail thanon onethe standardmethodology deviationto ordetermine therethese wereprior 10attainment orgroups fewerfor pupils).level 2 and level 3 please see the key stage 5 student group section.
Key stage 2
APrior standardattainment deviationgroups is aare measurebased ofon howoverall dispersedkey thestage data1 prior attainment, which is calculated using reading and mathematics. It was not possible to produce percentile ranks for groups in relationterms of attainment at key stage 2; this is due to the mean.spread Low,of data and, therefore, only statistical significance tests have been performed to identify high or small,low standardperformance.
Key deviationstage indicates1
Prior dataattainment isgroups clusteredare tightlybased aroundon theemerging, mean,expected and high,exceeding in reading, writing or large,mathematics standardearly deviationlearning indicatesgoals. dataIt was not possible to produce percentile ranks for groups in terms of attainment at key stage 1; this is moredue to the spread out.of data and, therefore, only statistical significance tests have been performed to identify high or low performance. Due to COVID-19 it has not been possible to calculate prior attainment groups for KS1 as the data does not exist.
Absence
TheAbsence followingsentences measuresare generated for FSM, SEND and EAL and are containedbased inon this2021/22 section:data.
Note that:
-
phonics
dueYearto1smallmeetingcohortstheof.expectedlowstandardandhighpriorattainmentgroups,itismuchlesslikelyforsentencestoappear -
key
itstagewas1notreadingpossiblemeetingtoflaggroupsentencesforphonicsattainment;thisisduetospreadstandardofthedata -
key
pupilstagegroup1sentenceswritingformeetingexclusionsthewillexpectednotstandardbeshown -
keyService stagechildren’s 1education mathematicsprovider meetingIDSRs do not incorporate 2017 data so sentences based on only the expectedlatest standard2 years, or the latest year are shown. For the exclusion sentence, service children’s education provider IDSRs only have data for the latest academic year available.
School and local context
School characteristics
keyThe stagechart 2shows readingschool-level progressinformation, based on the January school census, for 2020, 2021 and 2022. If a school has a sixth form, a separate row will appear that shows the context for years 12, 13 and 14 where applicable.
keyThe stagechart 2contains writingthe progressfollowing measures:
keythe stagepercentage 2of mathematicspupils progressin receipt of free school meals (FSM) at the time of the January census; these pupils are those who are/have been eligible for FSM and have claimed them some time in the last 6 years (Reception to Year 11). FSM data is not collected for sixth forms.
keythe stagepercentage 2of readingpupils meetingwhose thefirst expectedlanguage standardis not English or believed to be other than English
keythe stagepercentage 2of readingpupils achievingwith theSEND higherwho standarddo not have an education, health and care (EHC) plan (SEND support)
keythe stagepercentage 2of writingpupils meetingwith theSEND expectedand standardwho have a statement of SEND or EHC plan
keythe stagenumber 2of writingpupils achievingon greater depthroll
keyStability stageis 2a mathematicsmeasure meetingof the expectedpercentage standard
keyof stagestudents 2who mathematicswere achievingadmitted to the higherschool at the standard
key stagetime 2of reading,admission. writingThe andstability mathematicspercentage meetingis calculated by dividing the expectednumber standard
keyof stagepupils 2who EGPSmeet meetingthe stability criteria by the expectednumber standardof all eligible pupils (pupils in Years 1 to 11 with a single or main dual registration at the school at the time of the January school census). The stability measure is not available for school sixth forms.
keyA stagepupil 2is EGPScounted achievingas thestable higherif standardthey either:
keyjoined stagethe 2school sciencein meetingor thebefore expectedSeptember standardin Year 1
keyjoined stagethe 2school multiplicationin tablesor checkbefore (MTC)
Additionalthe sentencesmonth willby bewhich displayedat belowleast 5% of the tableyear showing:group had also joined the school
-
joinedschoolnumberinofaYearmonth/national1curriculumphonicsyearpupilscombinationandinhowwhichmanyatleast40%thedidyearnotgroupmeetjoinedthe expectedschoolstandard(the40%mustequatetoatleast10pupilsinprimaryschoolsor20pupilsinsecondaryschools) -
joinedschoolnumberinamonth/nationalcurriculumyearcombinationinwhichatleast10%the2yearphonicsgroupjoinedtheschool(the10%mustequatetoatleast10inhowprimarymanyschoolsoforthem20didpupilsnotinmeetsecondaryschools)andsamestandard.month/nationalcurriculumyearcombinationmetthesecriteriainatleastoneotheryeargroupwithintheschool
ExampleFor sentence
Ofeach group, school figures along with the 31national pupils,will 7show didfor noteach meetyear. The quintile boxes compare the expectedlatest standard.year Thereto werethe 28national pupil(s)distribution thatfor wereall screenedschools. inSpecial Yearschools 2are incompared 2022;with 27secondary ofschool thosenationals.
Trust/LA metlevel information
This section provides information about the expectedtrust standard.or local authority that the school is part of.
TheIf initiala releaseschool is part of thea IDSRtrust, it will nothave includeinformation about the MTCnumber datasetof asschools thisin the trust and the latest overall effectiveness grades of the schools within the trusts. If a school is receivedlocal laterauthority thanmaintained, otherthen primaryit measures.
Keywill stagehave 4information subjects
Englishabout Baccalaureatethe entry
The Englishgrade Baccalaureateprofile of schools within a multi academy trust (EBaccMAT) iswill adisplay setthose ofjudgements subjectsreceived atby GCSEthe thatschool keepsunder youngtheir people’scurrent optionsURN. openIt forwill furtherdisplay studythe andlatest futureinspection careers.outcome, Thewhich EBacccould requiresbe pupilseither tograded haveor studiedungraded. If Englisha languageschool andreceived literature,a mathematics,grade science,prior geographyto orjoining, history,then andthe aschool language.will Thebe DfEcounted hasin publishedthe further‘not guidanceyet aboutinspected’ section until it is inspected as part of the EBaccMAT.
Staff absence
TheSickness EBaccabsence entry data collected in the November 2021 census relating to the 2020/21 year is calculatedaffected usingby earlythe entryCOVID-19 andpandemic.
It discountingis rules.not Thispossible meansto thatdraw pupilsaccurate whocomparisons enteredwith EBaccprevious subjectstime inperiods 2021due willto havefactors thoseincluding entriespartially countedlimited towardsschool theiropenings, EBaccdelivery entryof rateeducation via virtual means in 2022.some However,cases, and potential differences in the subjectrecording entriesof datasickness onlyabsence. includesThe subjectsfigures enteredrelate into 2021.
Asickness sentenceabsence isonly shownand do not include non-attendance due to, for everyexample, schoolisolation whereand thereshielding.
For werethe percentage of teachers with at least 11one pupils.period Thisof describessickness absence measure the EBaccIDSR entrydisplays ratedata for the schoollatest inyear 2022.and Anotheralso sentence2018/19 shows(pre theCOVID-19), subjectto clusterhelp withinspectors assess the lowestimpact ratethe ofpandemic EBacchad entryon (ifthe school workforce.
To reduce burden during the entrypandemic, rateschools iswere belownot 75%).required Thisto couldprovide beinformation eitheron English,teacher mathematics,absences science,for humanities2019/20.
Data oron languages.school workforce attendance during the pandemic has been collected via the DfE’s education settings survey.
Example sentence
TheDuring EBacc2020/21:
79%entryofrateteachersinhadthisatschoolleastoneperiodofsicknessabsence.ThissignificantlyLanguagesabovenational.In2018/19,80%ofteachersatlowestleastentryonerateperiodof EBaccsicknesssubjectabsence.areasThis(56%).wassignificantlyabovenational.7daysonaveragewerelosttoteachersicknessabsence.Thiswasinthehighest20%nationally.
SubjectStaff entriesretention
Information on staff turnover as at keythe stage2020 4
Thisschool sectionworkforce showscensus is calculated using the subjectsnumber thatof thisfull schooltime enteredequivalent for(FTE) inturnover 2022leavers and 2021.the Subjecttotal entriesFTE datastaff at the school. A school will be highlighted as having high staff turnover if the turnover rate was in the highest 20% of schools for 2020the previous 2 years. Low staff turnover is not available.highlighted. ForSpecial 2021schools onwards,are discountingcompared hasto notprimaries.
It beenis appliedworth noting that turnover and leavers at a school level can be very volatile year to thisyear. tableFurther, when looking at rates of leavers and turnover it includesis entriesimportant thatto maybe notconscious haveof countedschool insize performanceas measures.this Earlyhas entriesa werebig notimpact includedon inrates, 2021.particularly for small schools.
The purpleDfE’s shadingpublished isschool darkerworkforce whereinformation moreprovides pupilsdata werefor entered.the Subjectsvacant arepost groupedmeasures byas EBaccat November 2021.
The DfE, subjectalso sectorsupplies areathe andstaff thenturnover listedsource alphabeticallydata.
Example bysentence
Atsubject.theEBacctimesubjectsofwillthebeNovemberpresented2021atcensus,the topschoolbyhaddefault.2full-timeteacherpostsvacant.Staffturnover(13%)wasinthehighest20%in2020/21.
Local area and school links
The subjectlocal sectorarea areassection areprovides basedinformation onabout thosethe listedlevel of deprivation in the qualificationlocal descriptionsarea in which the school resides, together with an aggregated pupil-derived deprivation indicator. Each deprivation indicator is based on the IDACI.
AThe shadedIDACI boxmeasures andthe correspondingproportion textof willall appearchildren ifaged the0 averageto point15 scoreliving for pupils in aincome-deprived particularfamilies. subjectIt is ina subset of the highestincome ordeprivation lowestdomain, 20%which measures the proportion of allthe schoolspopulation andin onlyan ifarea entryexperiencing levelsdeprivation wererelating atto orlow aboveincome. nationalThe entries.definition Cohortsof low income used includes both those people who are out of 10work orand fewerthose willwho notare bein highlighted.
Qualificationwork typebut iswho alsohave included,low whichearnings coversand who satisfy the following:respective means tests.
-
AS
-
EBacc
PleaseAS -
EBacc
notethatwehaveupdatedtheIDACIGCSE -
EBacc
(fromEnglishIndicesofDeprivation)measurefrom2015to2019.Assuch,someIDACIL1/L2valuescert -
Free-Standing
mayMathshavelevelchanged3 -
GCSE
-
Graded
asmusic -
L1/L2
acert -
Level
result1 -
Level
when1/2comparedtohistoricalIDSRs. -
Level
Example2sentenceOther
Theatschoollevellocation1Other
deprivationatindicatorlevelwasinquintile(lessdeprived)ofallschools.Thepupilbaseisinquintile4(moredeprived)ofallschoolsintermsofdeprivation.The cohorts
sentencesabovedisplaywhatquintiledeprivationrepresentleveltotalfallspupilsunder.atEachthequintileendrepresentsabound20%.stageThe4.Progress
higherandtheattainmentquintileatthekeygreaterstagethe4levelofdeprivation.The
A‘progressschool’sandlocalattainmentareaatiskeybasedstageon4’thetable2011displayslowerwherelayermeasuressuperoutputarea(LSOA)inwhichitresides.LSOAsaabovegeographicorhierarchybelowdesignednationaltoalongsideimprovethe associatedreportingpercentile.ofsmallareastatisticsinEnglandandWales.minimumvaluepopulationineachLSOAis1,000thevaluemaximumareisalso3,000.displayed.Regardinghouseholds,thereisaminimumof400householdsineachLSOAandamaximumof1,200.Arrows
Youindicatecanwhetherreadthefurtherschoolinformationvalue,aboutwhenthecompareddatawithusedforlocalvalue,areahasdeprivation.Thischanged.sectionAalsodarkprovidesshadedinformationupwardaboutarrowotherindicatesschoolsandalternativeprovisionproviderspupilsinthiswerefromdualnationalregisteredhasatimprovedaccordingfromtothe comparatorJanuaryyear2022(differencecensus.Thenumberpupilsthe2schoolstandardisdeviations).shownAinlighterbrackets.ExampleshadesentenceAccordingupwardtoarrowtheindicatesJanuarythe2022census,pupilsatthiswerefromalsonationalregisteredhasatimprovedtheslightlyfollowingfromproviders:Primary–SchoolA–URNXXXXXX(1)
Servicechildren’seducationproviderIDSRswillnotdisplayinformationonlocation-baseddeprivationinthissectionastheyarecurrentlynotcontainedindataset.FinanceTheyearIDSR(differencecontainsthelatestfinancialinformation–for2021/22forbothlocalauthoritymaintainedschoolsandacademies–including:therevenuereservetheleastschoolone(localstandardauthoritydeviation).maintainedArrowsschools)pointingordownwardstrustindicate(academies)thethatin-yearbalancethe difference
spendtopernationalpupilthehaslevelbecomeofworse,grantfundingcomparednationalshadingaveragerules.forAthehorizontalschoollinephasemeansandthetype(localauthoritymaintainedoracademy)
ForacademieswithinMATs,centraltrustincomeandexpenditurealsoconsidered.Incomeandexpenditureattributedcentralyeartrust(differenceiswasapportionedlesstothanindividualoneacademiesstandardondeviationaorpertherepupilwerebasis10toorprovidefewerapupils).combinedacademyandtrustfigureforeachacademy.A
Thestandardsourcedeviationforis athemeasureschooloffinancehowinformationdispersedisthe data isunderpinningintherelationDfE’stoschoolthefinancialmean.benchmarkingLow,tool.orYousmall,canstandardalsodeviationviewindicatesordownloadthesources.Serviceclusteredchildren’stightlyeducationaroundprovidertheIDSRsmean,willandnothigh,displayorinformationlarge,instandardthisdeviationsectionindicatesasdatatheyisaremorecurrentlyspreadnotout.containedinthedataset.Ethnicitywholeschoolandkeystage5EthnicityinformationcomesfromtheJanuary2022schoolcensus.sentencemeasuresstateshowmanyethnicgroupspresentin thisthesection:schooloutof17.The17possibleethnicgroupsare:-
Overall
WhiteProgressBritish White8Irish-
English
WhiteelementTravellerof ProgressIrish8Heritage -
Mathematics
WhiteelementGypsy/Roma WhiteofAnyProgressother8Whitebackground-
EBacc
MixedelementWhiteofandProgressBlack8Caribbean -
Open
MixedelementWhiteofandProgressBlack8African -
Overall
MixedAttainmentWhite8andAsian -
English
MixedelementAnyofotherAttainmentMixed8background -
Mathematics
AsianelementorofAsianAttainmentBritish8Indian -
EBacc
AsianelementorofAsianAttainmentBritish8Pakistani -
Open
AsianelementorofAsianAttainmentBritish8Bangladeshi -
Science
AsianvalueoraddedAsianBritishAnyotherAsianbackground -
Languages
BlackvalueoraddedBlackBritishCaribbean -
Humanities
BlackvalueoraddedBlackBritishAfrican -
Science
Black%oratBlackgradeBritish4AnyorotheraboveBlackbackground -
Languages
Chinese
Thisatexcludesgradethe4groups‘Anyotherethnicgroup’,‘Parent/pupilpreferrednottosay’and‘Ethnicitynotknown’.Thesentencestatesthosewith5%moreoftheschool.Forthissection‘Anyotherethnicgroup’,‘Parent/pupilpreferrednottosay’and‘Ethnicitynotknown’areincluded,somayappearinthetop5largestgroups.ExampleThisschoolhas3outof17possibleethnicgroups.Thosewith5%ormoreare:71%:White–British-
Humanities
14%:%Ethnicityatnotgradeknown 7%:4Asianor aboveAsianBritish–Indian7%:Mixed–WhiteandBlackCaribbean
Destinations
Yearatgroupkey stage 4contextCharacteristicsThis
Thetablechartdisplaysshowsschool-levelyeargroupcharacteristics,basedon2022Januaryschoolcensusforthefollowingmeasures:numberonrollthepercentageincontinuedreceipttoofcompleteFSMspecifiedatdestinations.theThistimedataofisthepubliclyJanuaryavailablecensus;andthesecomespupilsfromarethethoseDfE’swhodestinationsarecollection.The
ordatahavebeeneligibleFSMandhaveclaimedthemsometimeinlastyear6relatesyears(ReceptionYear11)the
percentageofspeakdestinations’Englishinas2020/21.anThisadditionalmeanslanguage
Shadingthoseonpupilsthewhochartreachedindicateswhenyearofgroupwasdifferenttootheryeargroupsintheschool.For5in(where2019/20.applicable),ThethererowareheaderdifferentdisplaysrulesthatDfEofusescompletedtoeducationallocateasstudentstodifferentyear.measures.The 2017/18yeardestinationsgroupcharacteristicsthedatacensusdata,sotheremaybestudentsareandnothereforelongermayonnotrollreflectbutsomestillchangesallocatedintothe revisedproviderdataset.foraccountabilitypurposes.PriorattainmentFor
Theapriordestinationattainmenttotablecount,presentshowinsustainschoolparticipationperformedforatathe6-monthpreviousperiod.keystageinrelationtotheiryeargroup.Blue
Weboxeshavewillbasedindicatepriorifattainmentainfigure2022was,onstatistically,thesignificantlyfollowingabovefactors:fortheYearsnational1average.,2,Orange3boxesandwill4indicatetherewhenisanofigurepriorwas,attainmentstatistically,datasignificantlyduebelowtoCOVID-19forYears5and6wehavebasedthisonpercentageaverage.whoachievedatleasttheexpectedstandardatkeystage1If
fordataYearshas7beenandsuppressed8thereisnopriorattainmentdataCOVID-19forcohorts,Years‘small9,cohort’10willandbe11shownweinhavebasedthisonthoseachievingexpectedCohortstandardsuppressionatkeystage2
Shadingindicateswhetherthepupilsschoolfollowsweretheaboverulesorusedbelowbynational.ThisistriggeredifService
schoolchildren’svalueeducationisprovider1IDSRsorwill2onlystandardhavedeviationsfromnational.forIfpupilswereinlinewithnational,adashisshown.Ifnumberyearofduepupilstowasdata10availability.orbelow,an‘X’isshown.16
Priortoattainment18atqualificationkeytypesstageand retention5The
Therequalificationwastypenoanddataretentionavailabletablesforarekeybasedstageon5finalpriordataattainmentforin2022.Thisisbecausethesepupilsdidnottakekeystage4examsin2020,duetoCOVID-19.Qualification
SENDtypescharacteristicsThis
TheretableislistsatheformalnumberassessmentoftostudentsdecideundertakingifeachatypepupilneedsastatementSENDoranEHCplan.Students
SENDmaysupportbeisworkingthetowardshelpmoreathanschoolonegivestypepupilsofthatqualificationfallsoutsidetheusualcurriculum.OutsidespecialistscantellorsupporttheclassteacherSENmaycoordinator.AnbeEHCcountedplanmoreisthanforonce.childrenStudentsandtakingyoungcoursespeoplethatagedareupnottofull25qualificationswhoareneedmoresupport.ThisextrahelpisavailableStudentsthroughtakingSENacademicsupport.qualificationsEHCotherplansthanidentifyAeducational,levelshealthareandnotsocialincludedneedsinandsetoutsupportundertoindividualmeetqualificationthosetypesneeds.ThebutJanuaryare2022includedcensusinprovidesthedatacohortforinformation.thisTherefore,table.ThetabledisplaysnumberofpupilsthecolumnschoolmaywhonothaveaddSENDupandtowhatthe totalneednumbercategoryis.The2halvestheandtablepercentagesrepresentmaypupilsnotwhoaddhaveupSENDtosupport100.andpupilswhohaveanEHCplan.Below
Italsoshowswhatyearpupilisin.ItflagsiftheschoolhasSENDwhichunitisandpresentedhowwhenmanythereSENDispupilssomethingaresignificantdisadvantaged.SENDorunitsexceptionalarespecialprovisionswithinamainstreamschool.TheseunitscontainseparateclassesteachforpupilswithSEND.Theseunits:receiveextrafundingfromlocalauthoritycaterforaspecifictypeortypesSENDnot(fortakingexample,anyautisticlevelspectrum3disorders)areusuallyforpupilswithstatementsEHC2plansDfE(butthisisnotrequired)
DisadvantagedpupilsarethosewhowereeligibleforFSM-approved qualificationatinany2022.timeThisduringhighlightsthewhenlasta6schoolyearsisandinchildrenlookedafter(incareoroflowestthe20%localnationallyauthorityfor thealatestdayyearormorewholatesthave2beenyears.adoptedfromcare).A
ResourcedsentenceprovisionwillrefersalsotobetheshownplacesifreservedtheatamainstreamforspecificpupilswithSEND.Thepupilslearnwithinmainstreamclassesbutrequiresomespecialistfacilities.Resourcedprovision:receivesextrafundingfromthelocalauthoritycatersforaspecifictypeortypesofSEN,forexamplespecificlearningdifficultiesis delivering
usuallyTforlevelspupilsinwith2023/24,statementsasorshownEHCinplans,publishedbutthisisnotrequired
Theresourcedprovisioninformationcomesfromthe’sdata.GIASservice.Retention
ProgressonandmainattainmentstudytrendProgressprogrammes8This section provides
showsdatatheonrelativeperformanceofschooltoforwhichProgress8andeachoftheProgress8elementsin2022versusthenationalusingsignificancetests.Ablueboxindicateswhenfigureretainswas,studentsstatistically,tosignificantlyabovenationalofaverage.Orangeboxeswillindicatewhenafigurewas,statistically,significantlybelownationallearningaverage.Theaimsecondrowboxesstudydisplayprogramme.whenTheameasure usedisin thisthesectionhighestis20%retained(blueandbox)assessed.Students
orarelowestcounted20%in(orangethebox).retainedWhenandbothassessedboxesmeasureareifshadedtheythereareshouldretainedbetoanaccompanyingsentenceinareasof theirinterestcoursesectionandofaretheassessed.IDSR.The assessment
Progressmay8not3-yearnecessarilytrendbesectioninshowshowschoolsubjecthasorperformedtypecomparedofwithqualificationothertheyschoolswerenationally,aimingoverallandeachtheirofstudiesthebegan.ProgressHowever,8elementsforeachoflastmust3beyears,regardlessofthemethodologytime.levelThereandisataleastclearindicationofpositionsizeinastermsofquintile,aim.whenForeachexample,quintilerepresents20%ofschools.Redboxeswillindicatewhenfigurewithwas,anstatistically,originalsignificantlymainbelowaimtheofnationaltechaverage.levelGreenatboxessizewill1indicatewouldwhenbeaconsideredfigureaswas,retainedstatistically,andsignificantlyassessedabovewiththenationalaverage.Quintileswilldisplay‘X’generalwhenexamtheyresultarebasedoncohorts10leastorsizefewer1.Data
pupils.isAlso,presentednostatisticalsignificancewillshowcohortsstudyofprogrammes:10orfewerpupils.-
A
Thelevelsarrows(includingindicateASanlevel) -
level
increase3orapplieddecreasegeneral -
level
in3progresstechscore.level -
level
These2aligntechnicalwithcertificate
From
the2019,progressonlytrendtechnicalanalysis.certificatesWewillhavebeonlyrecognisedmadeascomparisonslevelbetween22017–18,vocationalandqualifications2018–19.inThistheis16referredto 18asperformancemarkedlytables.higherInor2018,lowerinlegendreportedofathebroaderprogressrangeandofattainmentqualifications.trendThechart.DfE’sNoteguidancethatonthistechnicalisandnotvocationalbasedqualificationsoncontainsstatisticalthesignificanceliststesting.ofThequalificationsnumberthatincountbracketsinshows2019theperformanceeligibletables.A
cohort.student’sThestudycalculationprogrammethatunderpinstheseshownbasedinonthetheir‘Understandingmaintheaim.dataTheinDfEtheIDSR’s’16section.Servicetochildren’s18educationaccountabilityprovidermeasuresIDSRstechnicaldoguidenotprovidesincorporatefurther2017informationdata,onsohowonlythistheislatestdefined.16
2toyears18willsubjectshave–content.Valuelevel 3addedThis section shows the subjects
relativeenteredperformanceoftheschoolvalueaddedinkeystage4EBaccpillarsin2022usingsignificancetests.Orangeboxeswillindicatewhenafigurewas,statistically,significantlybelowthenationalaverage.Blueboxeswillindicatewhenafigurewas,statistically,significantlyabovethenationalaverage.Quintileshavenotbeenusedincharttoavoiddirectcomparisonbetweenschoolsduringavolatileperiod.Notethatsentencesthe2020areastoinvestigatesectionwillstillreportonthehighestlowestSubject20%entriesalongwithsignificance.IthasnotbeenpossibletoshowKS5in20202022isduetothevalueaddedmeasurebeingavailableduetoCOVID-19.The purple
EBaccshadingpillarisvaluedarkeraddedwhere3-yearmoretrendstudentssectionwereshowsentered.howSubjectstheareschoolgroupedhasbyperformedsubjectcomparedclusterwithandotherlistedschoolsalphabeticallynationallyfirstforbyscience,clusterlanguagesthenandbyhumanitiessubject.A
valueshadedaddedboxforandeachcorrespondingoftextthewilllastappear3ifyears,regardlessofmethodologypointatscorethefortime.pupilsThereinisa particularclearsubjectindicationisofthepositiontermsofquintile,orwhenlowesteachquintilerepresentsschools.schoolsRedandboxesonlyindicateifwhenentryalevelsfigurewerewas,atstatisticallyorbelowthenationalaverage.Greenboxesindicatewhenafigurewas,statisticallytheaverage.Quintileswilldisplayan‘X’whentheyarebasedoncohortsof10orfewerpupils.Qualification
Leveltype3valueaddeddatashownincluded,forwhichAcoverslevel,ASlevelandappliedgeneralqualifications.Redboxesindicateifscorewasstatisticallysignificantlybelowthenationalaverage.Greenboxesindicateifascorewasstatisticallysignificantlyabovethenationalaverage.The‘Alevel’groupincludesthefollowingAlevelqualifications:-
A level
-
applied
Alevel -
applied
Alevel
The‘ASlevel’groupincludesthefollowingASlevelqualifications:-
pre-U
ASprincipallevel(notcontinuedtofullAlevel) -
international
appliedbaccalaureateASlevelsingleaward appliedASleveldoubleaward
The
Forcohortsreference,above the section‘Arepresentleveltotalgroup’studentsDfEatreportthecombinesendtheseof2keygroupsstage 5.together.Attainment
Serviceatchildren’s16educationtoproviders18donothavedataforvalueaddedmeasures.Attainment8The
This‘attainmentsectionatshows16thetorelative18’performancetableofdisplaysthewhereschoolmeasuresforareAttainmentsignificantly8aboveandoreachoftheAttainment8elementsin2022usingsignificancetests.Ablueboxindicateswhenafigurewas,statistically,significantlytheaverage.Orangeboxeswillindicatewhenafigurewas,statistically,significantlyabovenationalpercentile.average.TheQuintilescohort,havevaluenotbeenusedinthischarttoavoiddirectcomparisonbetweenschoolsduringavolatileperiod.Notethatsentencesintheareastoinvestigatesectionwillstillreportonthehighestlowestvalue20%arealongalsowithdisplayed.significance.Arrows
TheindicateAttainmentwhether83-yeartrendsectionshowshowhaswhenperformedcompared towiththeothernationalschoolsvalue,nationallyhasforchanged.overallAAttainmentdark8shadedandupwardeacharrowofindicatesthethatAttainmentthe8elements:English,mathematics,EBaccandopen.Theisfromcomparednationalwithhasotherimprovedschoolsfromnationallyforeachoflastyear3(differenceyears,regardlessthemethodologythe2time.standardTheredeviations).isAalighterclearshadeindicationupwardofarrowtheindicatespositionintermsofquintile,differencewhenfromeachnationalquintilehasrepresentsimproved20%slightlyoffromschools.Quintileswilldisplayan‘X’whentheyarebasedoncohortsof10orfewerpupils.Servicechildren’seducationproviderIDSRsdonotincorporate2017data,soonlylatestyear2(differenceyearswillhavecontent.AttainmentthresholdsThissectionshowstherelativeperformancetheleastschool1forstandardattainmentdeviation).inArrowskeypointingstagedownwards4EBaccpillarsandkeystage5in2022.Orangeboxeswillwhentheadifferencefiguretowas,statistically,significantlybelowtheaverage.becomeBlueworse,boxeswithwilltheindicatesamewhenshadingarules.figureAwas,horizontalstatistically,linesignificantlymeansabovethe schoolnationalisaverage.similarQuintileshavenotbeenusedinthischartavoiddirectcomparisonbetweenschoolsduringavolatileperiod.Notethatsentencesinareasyearto(differenceinvestigatewassectionlesswillthanstill1reportstandardondeviationtheorhighestthereandwerelowest1020%oralongfewerwithpupils).significance.A
ThestandardEBaccdeviationpillaris agrademeasure4+of3-yeartrendsectionshowstheschoolhasperformedcomparedwithotherschoolsnationallyforpercentageisofpupilsachievinggrade4+science,tolanguagesandhumanities.TheschooliscomparedwithotherschoolsnationallyforeachoflastLow,3oryears,small,regardlessstandardofdeviationtheindicatesmethodologydataatthetime.Thereatightlycleararoundindicationofpositionandinhigh,termsoroflarge,thestandardquintile,deviationwhenindicateseachdataquintileisrepresentsmore20%spreadofout.schools.Quintileswilldisplayan‘X’whentheyarebasedoncohortsof10orfewerpupils.The following
AmeasureslevelareAAB%contained2-yeartrendsectionshowshowtheschoolperformedcomparedwithotherschoolsnationallyforthe%showsthepercentageofstudentswhohaveachieved3AlevelsatgradesAABorbetter,ofwhichatleast2arefacilitatingsection:subjects.Thefacilitatingsubjectsare:-
A level average point score
biology -
Tech level average point score
chemistry -
Best
physics mathematicsfurther3 A levels average point scoremathematics-
Applied
geography historyEnglishgeneral average point scoreliterature-
A
classical/modernlevel AAB %languages
Destinations
Key16stageto518attainmentThis table
sectiondisplaysshowsthe proportionrelativeperformancethewhoschoolcompletedfortheirkeystudystageprogramme5ataveragepointscoresin2022.Orangeboxeswillindicatewhenafigurewas,statistically,significantlybelownationalwhoaverage.wentBlueonboxestowillsustainedindicateeducationwhenoraemployment,figurewhowas,wentstatistically,onsignificantlyabovethenationalaverage.Quintileshavenotbeenusedinthischartavoiddirectcomparisonbetweenschoolsduringvolatilenotperiod.sustainedNoteorthatwhosesentencesactivityinwasthenotareascaptured.toItinvestigatefurthersectionwillstillreportonthehighestandlowest20%alongwithsignificance.TheAPS2-yeartrendsectionhowproportiontheofschoolallperformedstudentscomparedwentwithotherschoolsnationallybasedaverageanpointapprenticeship,scoretotheanyfollowing:educationAlevel,best3Alevels,appliedgeneral,techlevel(level3)technicalhighercertificateseducation.(level2).The
Average2017/18progressdestinationsscore(APS)perentryiscalculatedbydividingthetotalnumberofpointsachievedbystudentsbythetotalsizeofentriesforthosestudents.ThisisthenaggregatedtogiveanoverallAPSscoreforaprovider.Entriesthedatasizethatofyearthequalificationstudentsmay notcontributereflectmultiplesomequalificationschangestothemeasure.Studentsmayalsobecountedmorethan1qualificationtype.Servicechildren’seducationproviderIDSRsdonotincorporate2017data,soonlylatestdataset.2yearswillhavecontent.Reading,writingandmathematicsBlue
Thefollowingguidanceisrelevantforschoolswithaprimaryphase.Thissectionshowshowtheschoolhasperformedcomparedwithotherschoolsnationallyoverallandforeachelementforeachofthelast3years,regardlessofthemethodologyatthetime.Thereisaclearindicationofthepositionintermsofthequintile,wheneachquintilerepresents20%ofschools.Redwhena figure was, statistically, significantly abovebelowthe national average. OrangeGreenboxes will indicate when a figure was, statistically, significantly belowabovethe national average.If data
Ashasinbeenthesuppressedrestdueoftothesmallreport,cohorts,figures‘smallarecohort’displayedwillinbegreyshownwhenintheythearetable.basedCohortonsuppression10inorthisfewertablepupils.followsAlso,thenorulesstatisticalusedsignificancebywilltheshowDfE.forcohortsof10orfewerpupils.For
Thethearrowsdestinations,indicateanincreaseordecreaseinprogressscore.Thesealignwithprogressusestrendaanalysis.flexibleWeendhaveyearonlymadecomparisonsbetween2017/18,and2018/19.Thisisreferredaswhichmarkedlystudentshigherareorincludedlowerin the measure.legendoftheprogressandattainmenttrendchart.Notethatthisisnotbasedonstatisticalsignificancetesting.calculation16thattounderpins18theseaccountabilityismeasuresshowntechnicalinguidethe‘UnderstandingthedataintheIDSR’containssection.furtherTheinformationnumberoninbracketsshowsnumberofentries.This
Fordata2022istheretakenarefrom2rowsofboxes.Theboxesintopsourcerow‘Destinationscontaintheoutcometheandstatistical16significancetotests.18Orange(KS5)boxesstudents:will2019’,indicatewhichwhenincludesafullfiguredefinitionswas,ofstatistically,significantlybelownationalusedaverage.andBluefurtherboxesbreakdownswillofindicatethewhendata.Pupil
agroupsThe
figurepupilwas,groupstatistically,sectionsignificantlydisplaysabovethe performancenationalaverage.Thesecondrowboxesgroupswillfordisplaywhenameasureisinhighestgroups20%disadvantaged(blueandbox)low/middle/highorpriorlowestattainers.20%Absence(orangemeasuresbox).Whenbothboxesshaded,forthereFSM,shouldSENDbeandanEnglishaccompanyingassentenceaAL.inOnlytheareasofinterestsectionofIDSR.Otheryear’sattainmentdatameasuresThefollowingguidancerelevantinforthisschoolssection.withaprimaryphase.Shaded
Thisboxessectionshowshowtheschoolhasperformedcomparedwithotherschoolsnationallyoverallforwilleachappearelementwhereforeachoflastdiffers3toyears.thatThereisaclearindicationpositionschool.inThetermstextofandtheshadingquintile,arewhenbasedeachonquintilesignificancerepresents20%ofschools.Redboxeswillindicateawithfigurewas,statistically,significantlybelowaverage.forGreenallboxesmeasures,willexceptindicateforwhenabsence,awhichfigureiswas,basedstatistically,onsignificantlyquintileabove(highest/lowestthe20%).nationalExclusionsaverage.andAsphonicsinpupilthegroupsrestdoofnottheappearreport,figuresaredisplayedgreysection.whenSentencestheyare based on the10expectedorstandardfewerandpupils.doAlso,notnoappearstatisticalsignificancewillshowcohortshighofstandard.10orfewerpupils.We
Forno2022longerthereincludeareprior2attainmentrowsgroupsofforboxes.keyThestageboxes1 in thisthesectiontoprowcontaintheoutcomestatisticalduesignificancetotests.lackOrangeofboxespriorwillattainmentindicatedata.Pupil
whengroupadifferencesfigurecanwas,bestatistically,meaninglesssignificantlywhenbelowanalysedtheatnationalschoolaverage.level,Blueparticularlyboxeswillindicatearelatefiguretowas,smallstatistically,cohorts.significantlyabovethenationalaverage.secondshouldrowbeofaboutboxesmeetingwilldisplaywhenameasureisinhighestof20%all(bluepupils.If
box)performanceordoeslowestnot20%differ(orangefrombox).thatWhenofboththeboxesschool,arenoshaded,grouptherewillshouldbe flagged.anaccompanyingsentenceintheareasofinterestsectionoftheIDSR.SubjectentriesKey
SubjectentriesatkeyPrior
Thisattainmentsectiongroupsshowsarethebasedsubjectsonenteredoverallforkeybystagethis2schoolpriorinattainment,2022,which2021and2019.Subjectentriesdatafor2020notusingavailable.readingThereandmaymathematics.16
betosome18Because
differencesofbetweenthe2019COVID-19entriespandemic,andnolaterdatayears.forFor162021onwards,discountinghasnotbeenappliedthisstudenttablegroupsandwillitappearincludesinentriesthethatIDSRmaynothavecountedperformanceduemeasures.toEarlytheentrieslackwereofnotpriorincludedattainmentindata.2021.Key
Thestagepurple2Prior
shadingattainmentisgroupsdarkerwheremorepupilswereentered.Subjectsgroupedonbyoverallsubjectkeyclusterstageand1listedprioralphabeticallyattainment,firstwhichbyclusterthenbysubject.ThisbasedusingonreadingthesubjectfamiliesclustersshowninTable1.Absence
Table1:MappingofsubjectfamiliestosubjectclustersAbsence
Qualificationsentencestypeareisgeneratedalsoforincluded,FSM,whichSENDcoversandtheEnglishfollowing:ASEBaccasASEBaccanGCSEEBaccadditionalL1/L2languagecertFree(EAL)StandingandMathsarelevelbased3GCSEGradedonmusicL1/L22021/22certLeveldata.1Note
Levelthat:1/2-
due
Levelto2 Othersmallatlevel1Otheratlevel2
Theabovethesectionrepresenttotalpupilsattheendkeyandstagehigh4.Subjectpriorentriesattainmentatgroups,keyitstageis5much–lesslevellikely3Thissectionshowsthesubjectsenteredbytothisappear -
it
schoolwasinnot2022,possible2020toandflag2019.groupSubjectsentencesentriesdata2020attainment;isthisnotavailable.Thepurpleshadingdarkertowherethemorespreadstudentsofwereentered.Subjectsaregroupedbysubjectclusterandlistedalphabeticallyfirstbyclusterthenbysubject.Qualificationtypeisalsoincluded,whichcoversfollowing:Alevel-
pupil
appliedgroupsinglesentencesaward appliedfordoubleexclusionsawardpre-Uwillprincipalinternationalnot be shownbaccalaureate
Thecohortsabovethesectionrepresenttotalstudentsattheendofkeystage5.Understanding the data in the IDSR
Statistical significance
Assessment data and information are starting points for inspectors’ discussion with schools. Statistical significance testing is used in the IDSR to draw attention to noteworthy values. These values show when differences in school’s performance may be due to more than chance variation. The IDSR uses percentile ranking as well as statistical significance testing. This allows us to look at relative performance across time while also highlighting noteworthy changes.
For progress measures, the DfE provides Ofsted with the 95% confidence intervals, enabling the statistical significance to be calculated. The DfE publishes guidance about the Progress 8 data and confidence intervals.
Statistical significance calculations use cohort size, or number of pupils, in the calculation. Therefore, a large cohort is much more likely to show a statistically significant difference to national averages than a small cohort.
Significance calculation for threshold measures
A normal approximation to the binomial distribution is used to identify statistically significant differences between proportions of pupils (shown in the areas of interest).
Before applying the test, we check that:
nP
and
n(1-P)
are greater than or equal to 5.
When:
-
P represents the national average of pupils reaching the expected standard
-
n represents the total number of pupils
The calculation is as follows:
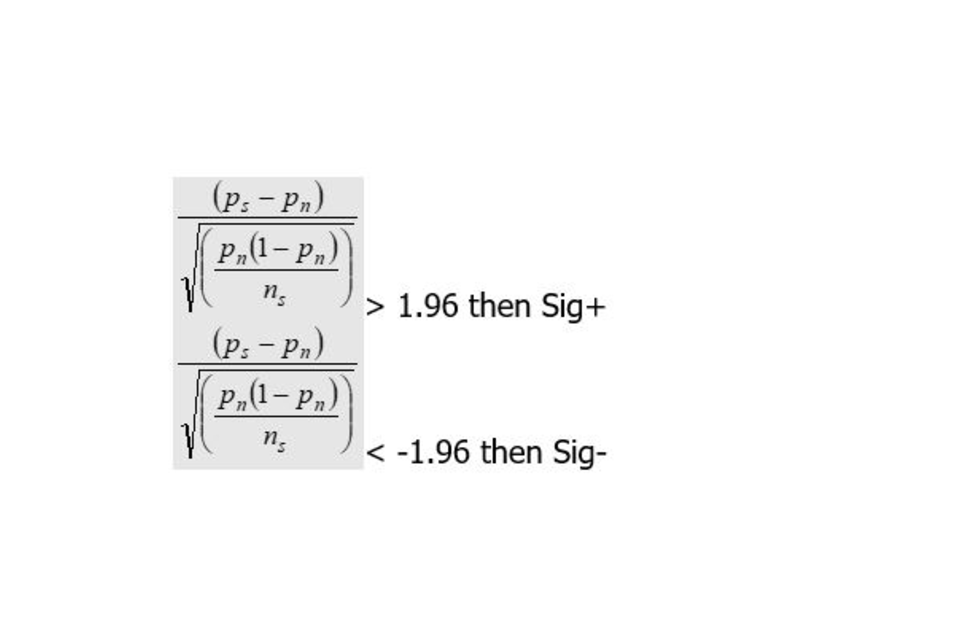
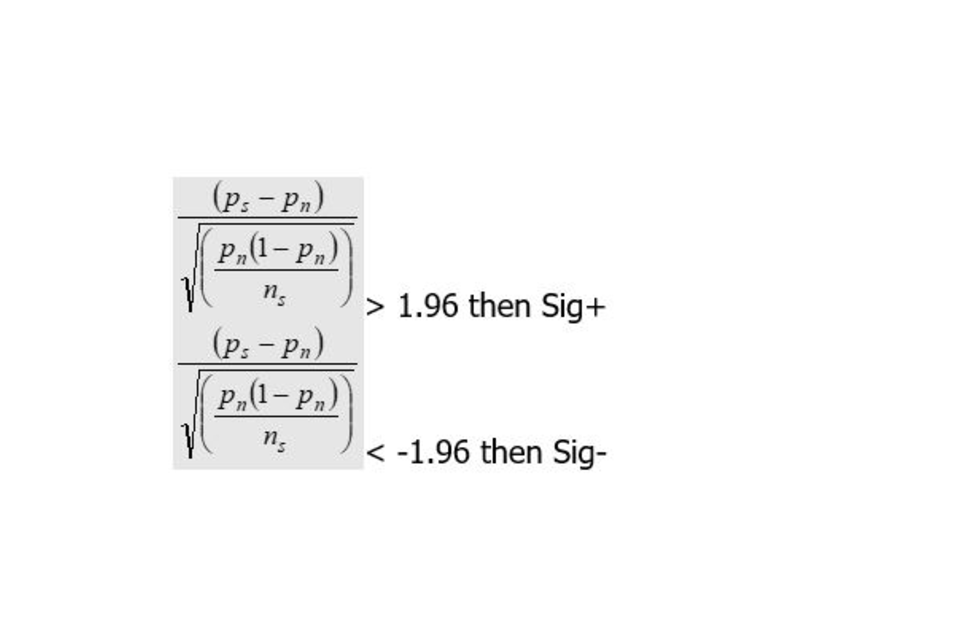
Otherwise not statistically significant.
When:
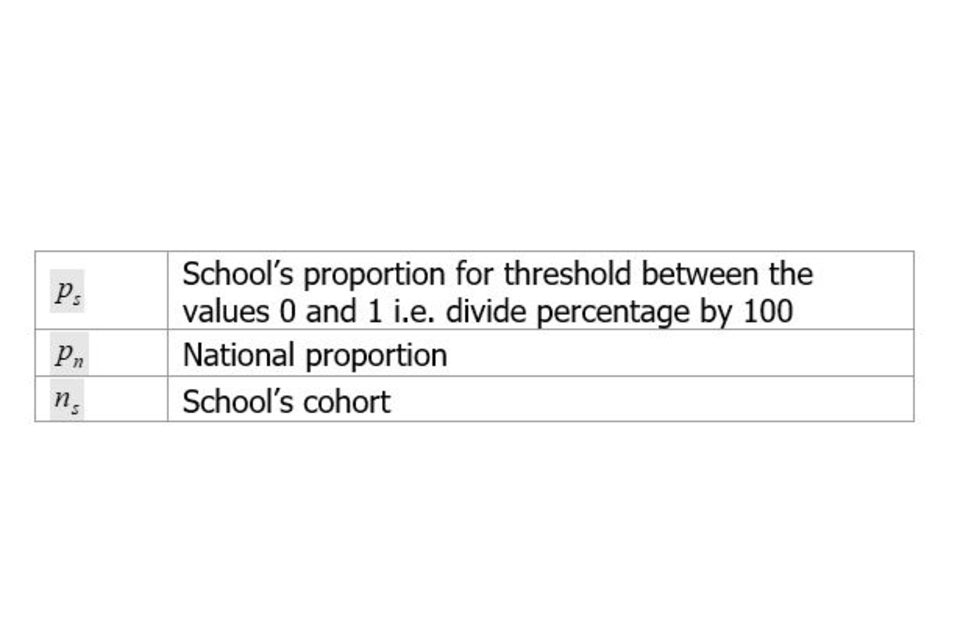
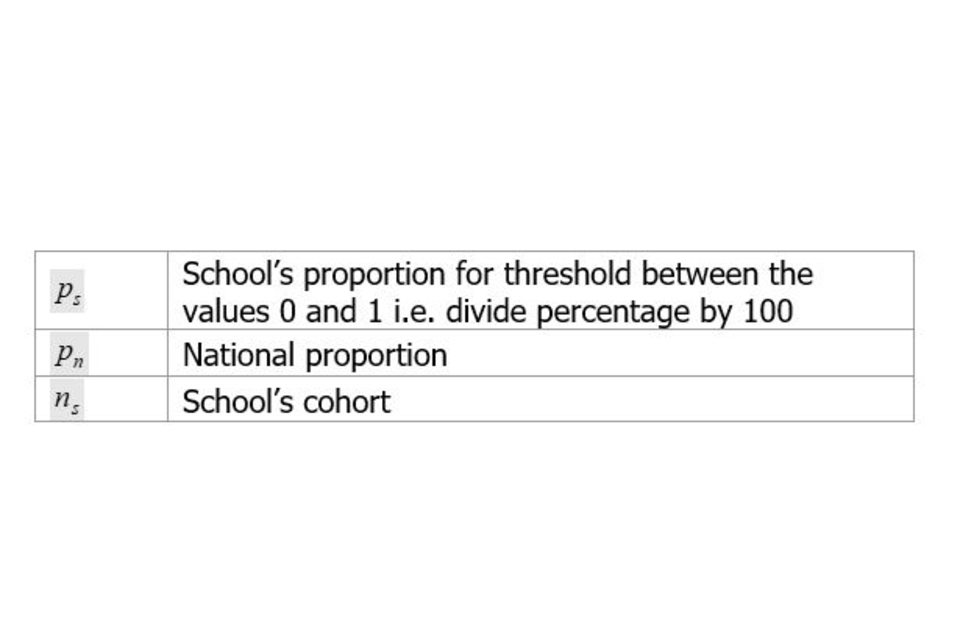
This methodology is applied to the following performance measures:
-
key stage 2 expected standard and high standard/greater depth thresholds
-
key stage 1 expected standard and greater depth thresholds
-
Year 1 phonics
-
destinations
One-year
Progressandtrend4-yearanalysisarrows – worked examplecalculationSchool
ProgressA’s data for the last 2 years is shownabelow:Data withinyear% year,expectednormstandardNational referenced%measure.expectedScoresstandardNational arestandardnotdeviationDifference directlyfromcomparablenationalDifference yearinonstandardyear.deviation2022 54% 75% 20% -21 Topercentageallowpoints-1 2023 96% 75% 20% +21 forpercentagedirectpoints+1 When
comparisonsweacrosscompareyears,theeverydifferenceprogressinscorestandardisdeviationstandardisedfromusing2022 to 2023, the schoolfollowinghasformula:(Progressmovedscoreup–bymean)2/standard deviations (from -1 to +1), therefore the IDSR will show a dark upward arrow.deviationAbsence and exclusions
Absence data is usually in all IDSRs by December each year. This is because data is only provided to Ofsted after the primary IDSR release.
The permanent exclusions and suspensions data is one year behind. For example, 2017/18 exclusions data was published in July 2019. Exclusions data is for cohorts before the one shown on the context page and the number on roll may have changed.
For absence and suspensions, special schools are compared with
tothe national value for secondary schools. For permanent exclusions, special schools are compared withtothe national average for special schools.Data sources
All data in the IDSR is from the DfE. We use the data to calculate school-, local-authority- and national-level data. Pupil-level data is anonymous and does not contain names or addresses. It is not shared with inspectors at any point.
We receive the following data sets from the DfE to produce the IDSR.
National pupil database:
-
key stage 1 and phonics
-
school census to populate contextual sections
-
ASP all key stages
Performance tables:
-
school and college database (SCDB) primary and secondary
-
key stage 2
-
key stage 4
-
key stage 5
-
level 3 value added
Absence and exclusions data:
-
school-level exclusions
-
2-term absence
-
3-term absence
-
1-term absence (autumn 2020)
-
1-term absence (summer 2021)
You can find more information on the accountability measures in these DfE guidance documents:
-
secondary accountability measures (including Progress 8 and Attainment 8)
Special schools and pupils with SEND
specialeducationalneedsanddisabilitiesAn IDSR is produced for special schools. However, it may contain very little information about the performance of pupils.
Pupils with SEND are a diverse group with differing needs and expectations. Therefore, the IDSR will no longer display any averages for this group.
Contextual information is provided for the group, including the breakdown of the number of pupils with SEND by primary special educational need.
Junior and middle schools
A standard sentence appears to explain that junior and middle schools have lower progress scores on average. Also, due to the age range of pupils at middle schools, pupils will have only attended a middle school for a short time before they take their key stage 2 tests.
Inspectors should be aware of this and, as with any inspection, carefully consider a range of information and data.
Missing data
There are a few possible reasons why data for some years is not shown for a particular measure.
In charts and tables, data may not be shown for some years because:
-
the measure did not exist, was defined differently or was not available to Ofsted for that year; if this is the case, the data is shown as a dash
-
the school had no pupils for a particular measure in that year; if this is the case, the cohort will be shown as a 0 and a dash will be shown for the measure
-
if the school recently changed legal status, for example from a local authority maintained school to a sponsor-led academy, the data may be shown under the predecessor school name or unique reference number (URN) in ASP
National figures
The national figures may differ from the figures published in the DfE’s performance tables and ASP. This is due to the varying decimal precisions used between organisations.
The disadvantaged pupil group is compared with
tothe national for pupils who are not disadvantaged.Prior attainment pupil groups are compared with
totheir respective pupil group nationally.Service children’s education providers have been assigned a phase based on the ages of pupils in the school.
Cohorts and numbers of pupils included
Cohorts display the total number of pupils based on the group and year of the measure presented.
For measures when all pupils were entered, the cohort shows the number of pupils the measure is based on. For some measures, it is used as the denominator for percentages.
If there have been any leavers and joiners, then the cohort number shown on progress and attainment data may not match the context section. The context section is a snapshot of the day the school census is taken in January of that year.
The ‘number of pupils included’ on progress pages only includes pupils with prior attainment information.
Key stage 5 cohorts
There are different rules that DfE uses to allocate students to the different measures. The year group characteristics is based on the census data so there may be students that are no longer on roll but still allocated to the provider for accountability purposes. The qualification type table is based on revised data, whereas retention is from final.
For the destinations, the DfE uses a flexible end year to determine which students are included in the measure. There are more details in the accountability guide.
Conditions of use
The IDSR conditions of use and storage are that:
-
the IDSR is to be used only for educational and analytical purposes and for informing inspection, not for any other purpose
-
data presented in the IDSR is to be shared only with those who need and are authorised to have access to the information
-
only nominated users may access the IDSR and these users must be made aware that they cannot share the IDSR without permission from the data owner
-
the IDSR should be saved in a secure location with limited access
Key stage 5 student groups
Prior attainment student groups are shown for some measures. These groups are based on students’ average points score at key stage 4, which is calculated by giving a point score to each grade and taking an average across all the student’s grades.
Thefollowingtableshowsthecorrespondingpointsscoresforeachgrade.GCSEgrade(oldgradingstructure)PointsscoreA*8.5A7B5.5C4D3E2F1.5G1U0Notethatin2017,2018and2019,pointswereallocatedtonewGCSEs(withgradesof9to1).In the IDSR, we use groups of scores. For level 3 students, these are as follows:
-
students with prior attainment grades 7–9 (equivalent to grades A*–A under the old grading structure)
-
students with prior attainment grades 4–6 (equivalent to grades B–C under the old grading structure)
-
students with prior attainment grades 3 and under (equivalent to grades D–G under the old grading structure)
To align students’ average points scores to these groups, we calculate an upper bound and lower bound for each group.
To calculate the upper bound for each group, we calculate the midpoint between the maximum points score within the group and the minimum points score within the next highest group.
For example, to calculate the upper bound for the 4–6 group, we take the midpoint between the maximum points score for the 4–6 group (5.5) and the minimum points score for the 7–9 group (7):
Upper bound = (5.5 + 7) / 2 = 6.25
Similarly, to calculate the lower bound for each group, we calculate the midpoint between the minimum points score for the group and the maximum points score for the next lowest group.
For example, to calculate the lower bound for the 4–6 group, we take the midpoint between the minimum points score for the 4–6 group (4) and the maximum points score for the 3 and under group (3):
Upper bound = (3 + 4) / 2 = 3.5
These calculations produce the following average points score boundaries.
GCSE grade group Average points score boundaries 7–9 6.25 and above 4–6 3.5–6.25 3 and under 0–3.5 For level 2 students, we follow an equivalent process to calculate average points score boundaries for the following groups.
GCSE grade group Average points score boundaries 3-9 2.5 and above 2 1.25–2.5 1 and under 0–1.25 For value added data relating to A level, AS level and applied general qualifications, and completion and attainment data relating to tech level qualifications, the following groups based on prior attainment for level 3 students are shown:
-
students with prior attainment grades 7–9 (average points score of 6.25 or higher)
-
students with prior attainment grades 4–6 (average points score of 3.5 or above up to, but not including, 6.25)
-
students with prior attainment of 3 and under GCSE point score (average points score below 3.5)
For completion and attainment data relating to technical certificate qualifications, disadvantaged students and the following groups based on prior attainment for level 2 students are shown:
-
students with prior attainment grades 3–9 (average points score of 2.5 or higher)
-
students with prior attainment grade 2 (average points score of 1.25 or above up to, but not including, 2.5)
-
students with prior attainment grade 1 and under (average points score below 1.25)
If performance does not differ from that of the provider, no sentences will appear.
Data protection
When accessing the data in the Ofsted IDSR service, you must recognise the privacy of that data and always comply with the Data Protection Act 2018. The Data Protection Act 2018 is the UK’s implementation of the General Data Protection Regulation (GDPR). You must ensure that you use the data that you have access to for the purpose for which the service was set up and that you do not use the data for any other purpose. You must ensure that the data is processed securely and that it is not subject to any unauthorised use or disclosure.
Last updated 18
-
We have released the 2023 primary IDSR with IDSR developments for all schools, as highlighted in our last newsletter. The main data updates are latest 2023 key stage 2, key stage 1, phonics, contextual data and 2021/22 suspensions and permanent exclusions.
-
We have updated the inspection data summary report (IDSR) for all schools. The main changes includes the 16 to 18 final 2022 data, including the updated retention measure. We also updated the trust/local authority level information section to include the most recent inspection outcome (graded or ungraded) based on latest URN for trusts only.
-
We have updated the inspection data summary report (IDSR) for all schools. The following data has been updated: Key stage 4 - final, Key stage 2 – final (including the multiplication tables check) and absence data – 3 terms.
-
Updated the secondary inspection data summary report (IDSR). The main changes are revisions to key stage 4, 16-18 data, pupil movement between 2021 and 2022 and destinations data. Also included are changes to the way we calculate key stage 4 subject entries.
-
Updated the primary inspection data summary report (IDSR). The main changes are revised key stage 2, final key stage 1 and final phonics data. Also included are minor changes to the pupil movement section of the secondary school IDSR.
-
Updated with absence data.
-
Ofsted has released the 2022 secondary IDSR and the guidance has been updated to reflect this. The main changes include the release of 2022 key stage 4 attainment and progress data, key stage 5 attainment and developments to the pupil movement section.
-
Ofsted has released the 2022 primary IDSR and the guidance has been updated to reflect this. The main changes are latest 2022 key stage 2, key stage 1, phonics, contextual data and 2020/21 suspensions and permanent exclusions. Also included are updates on the new functionality to remove sentences highlighted in grey.
-
Guidance updated to reflect that EYFS profile data is no longer included in the inspection data summary report (IDSR).
-
Updated with absence and finance data.
-
The guidance has been updated to reflect the new web-based IDSR format, new data received since their last release and the integration of school sixth form guidance.
-
Guidance updated in response to user queries, including information on what ‘not authorised’ means, clarification on average number of qualifications for 2021 and further details about the stability measure.
-
Ofsted have released a November 2021 IDSR and the guidance has been updated to reflect this. The main changes are latest 2021 contextual data, a new section for 2021 subject entries and new terminology for suspensions. Supporting tables spreadsheet updated: 2021 prior attainment national averages, autumn 2020 absence bounds, suspensions bounds have been updated or added to for 2021. No performance bounds have been updated. Sentence master list updated to reflect minor improvements/changes/combinations to current area of interest sentences and incorporating 2020 and 2021 figures where applicable.
-
New section of guidance added for the release of autumn 2020 absence data. This data is based on the DfE census collection and has been provided as a new section within the IDSR.
-
Added two spreadsheets: sentence master list and supporting data tables.
-
Guidance amended to reflect the latest version of the IDSR, including example reports.
-
Updated guidance to incorporate the addition of 'service children education providers' and the supporting tables have been updated to reflect the release of revised key stage 4 data.
-
Updated to include final 2019 EYFS, supporting tables updated with revised KS2, data for disadvantaged pupils and final 2019 EYFS and a new master list of all 2019 areas of interest sentences.
-
Updated the guidance to enhance users understanding of the ‘grey’ area of interest sentences and added more direct links for ease of use.
-
Updated supporting data tables to include key stage 1 attainment of the expected standard by Early Years Foundation Stage prior outcome.
-
Updates the 'English Baccalaureate entry' section.
-
Updated guide and data tables following further releases of data.
-
Added IDSR guidance for secondary schools.
-
Added a link to the DfE Sign-in for users to log into Analyse School Performance to view and download their schools' IDSR. Also added an example secondary school IDSR.
-
Added 2019 supporting data tables.
-
Added an example inspection data summary report.
-
First published.